Scan Management
This guide covers how to monitor, manage, and troubleshoot Javelin RedTeam scans once they have been initiated. Learn how to track scan progress, cancel running scans, and handle failed scans.
Monitoring Scan Progress
Once a scan is initiated, it will enter the queued state and you'll be redirected to the Assessments List view.
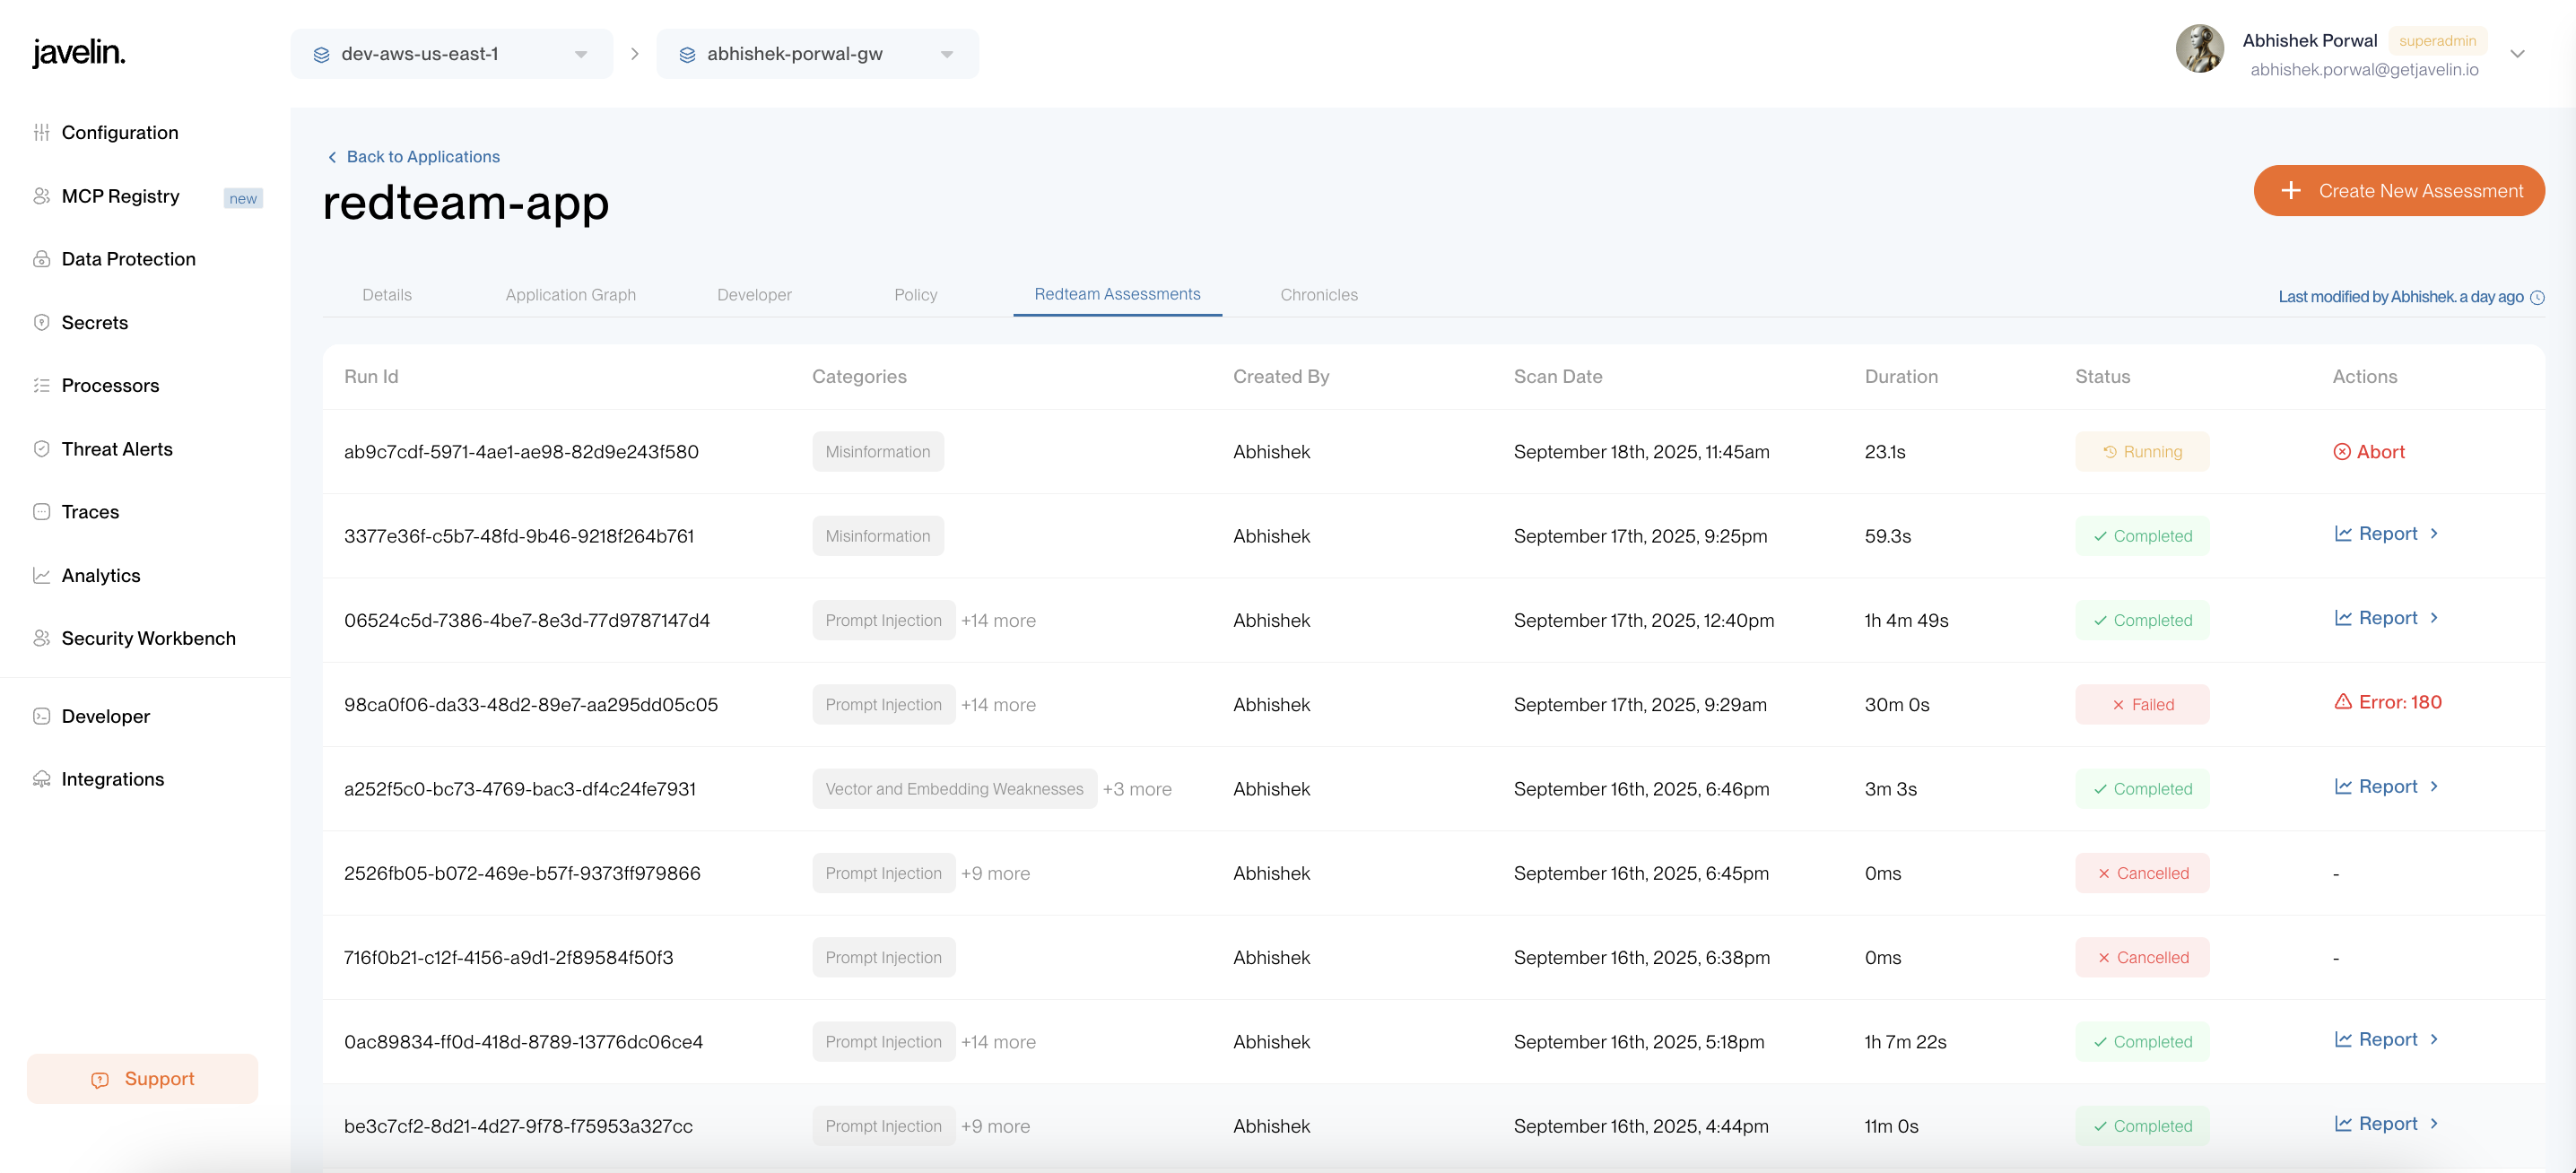
The status of the scan on this screen will transition from queued → running → completed or failed.
Scan Status Indicators
| Status | Description |
|---|---|
queued | Scan is waiting in the queue to be processed. |
running | Scan is currently in progress. |
completed | Scan completed successfully. |
failed | Scan encountered an error during execution. |
cancelled | Scan was manually cancelled during execution. |
Scan Tracking
- Each scan run is assigned a unique Scan ID and unique RunId for tracking and reporting purposes
- You can monitor real-time progress in the Assessments List view
A completed status only indicates that the scan ran to completion. It does not imply a vulnerability-free result—vulnerabilities may still be present.
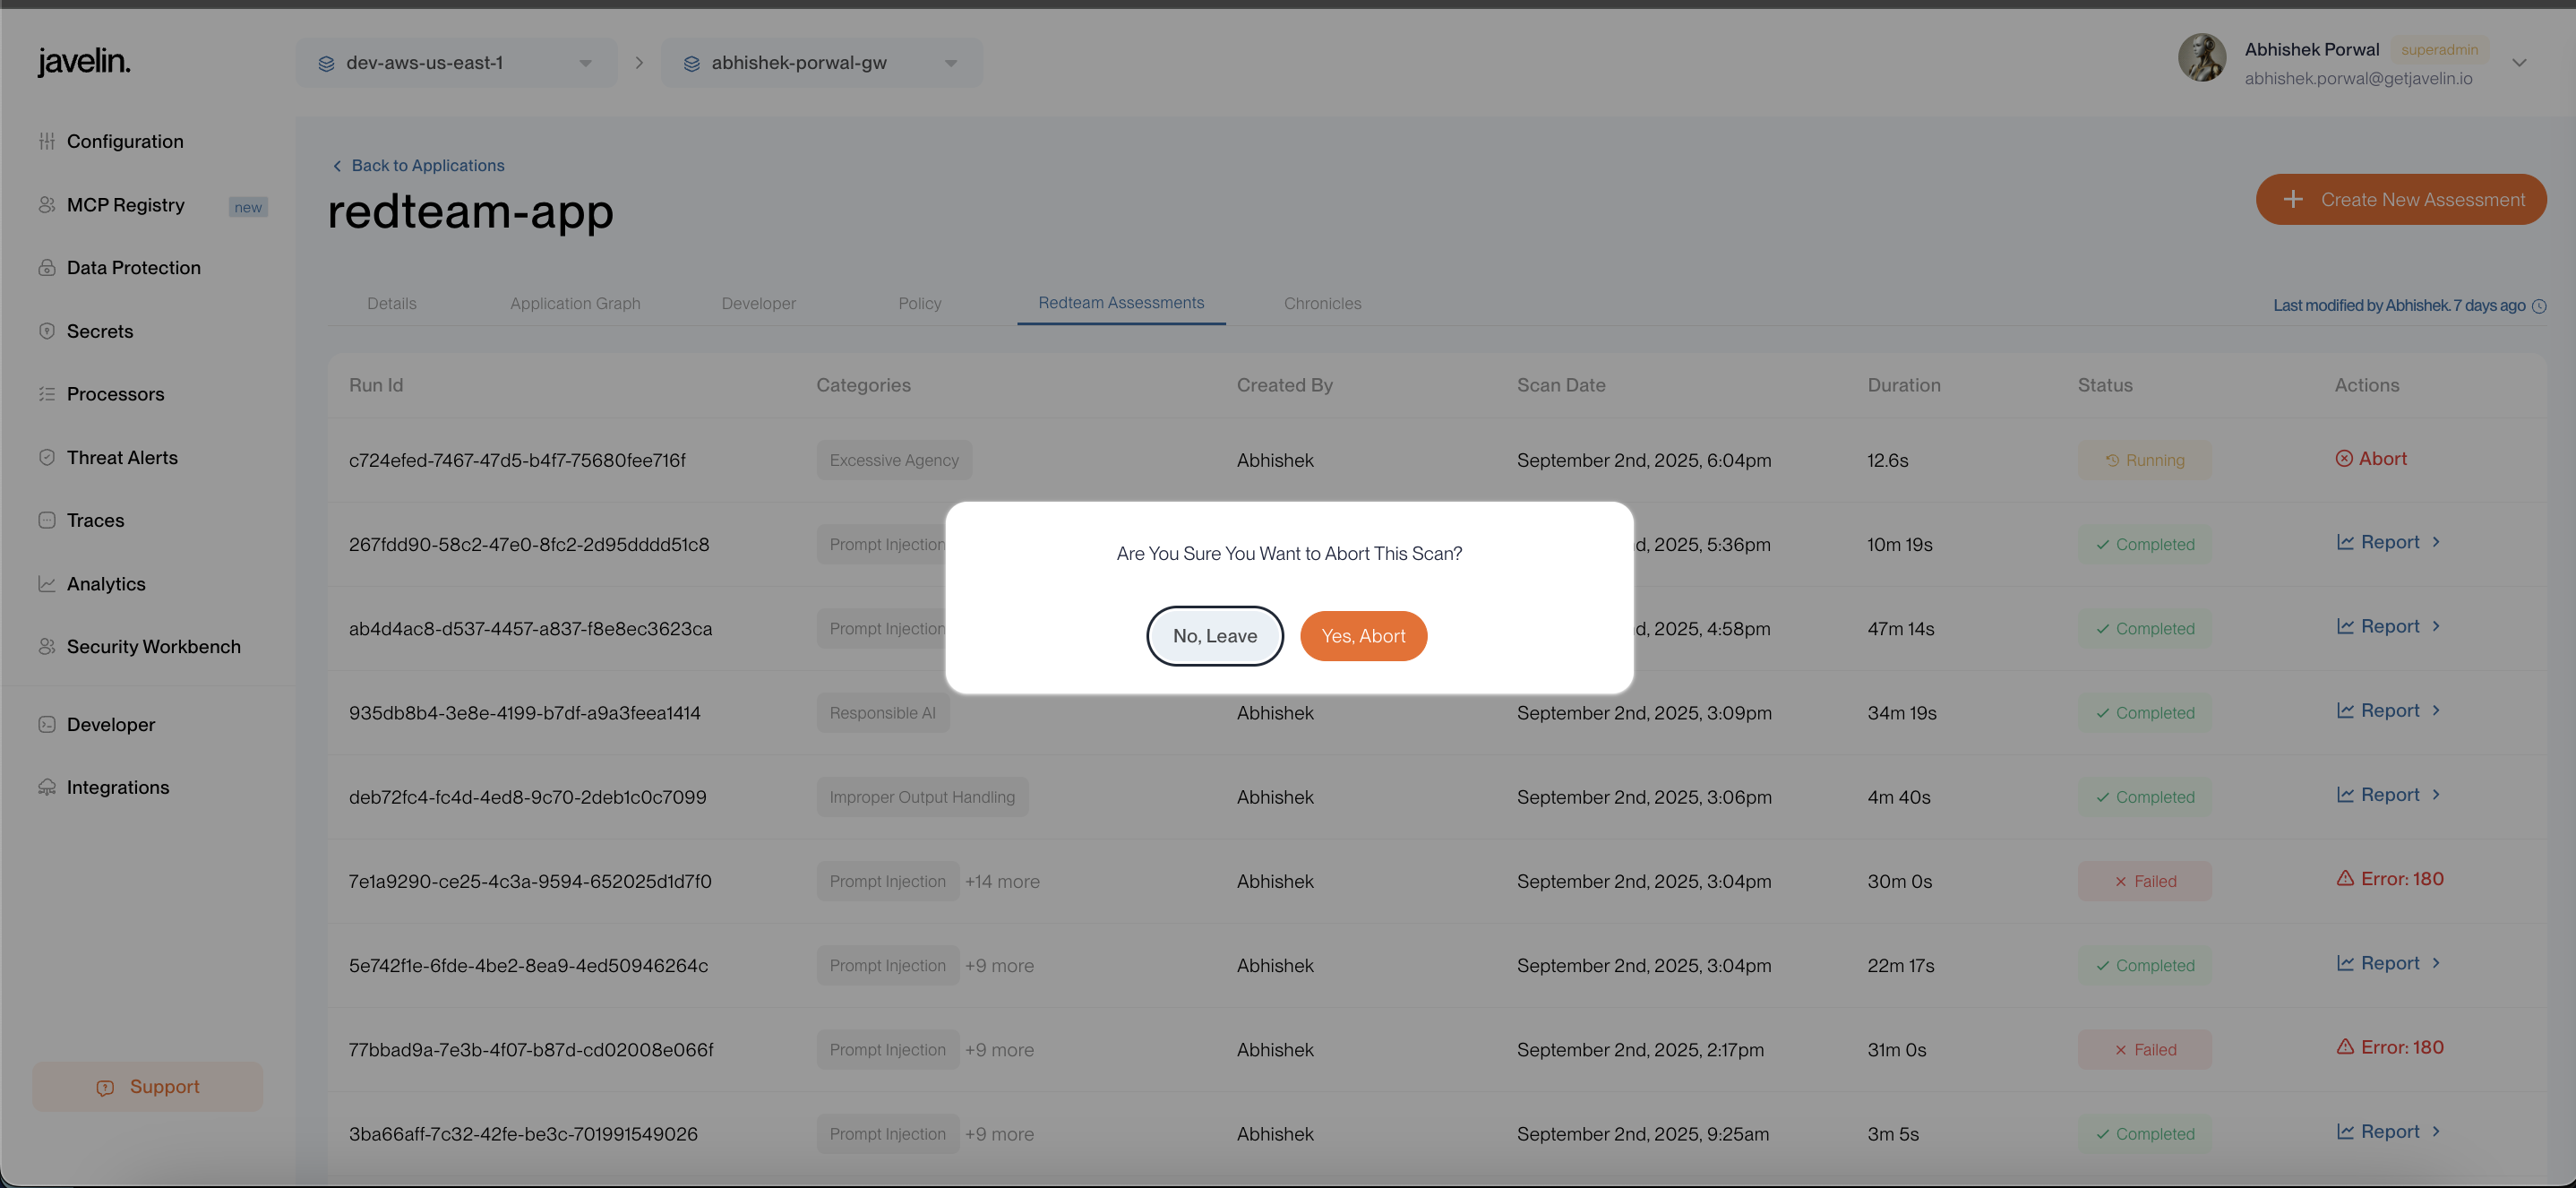
Cancelling a Scan
To cancel a running scan, click on the Abort button available in the Actions column of the scan table.
A confirmation dialog will appear. Click Yes to confirm and abort the scan.
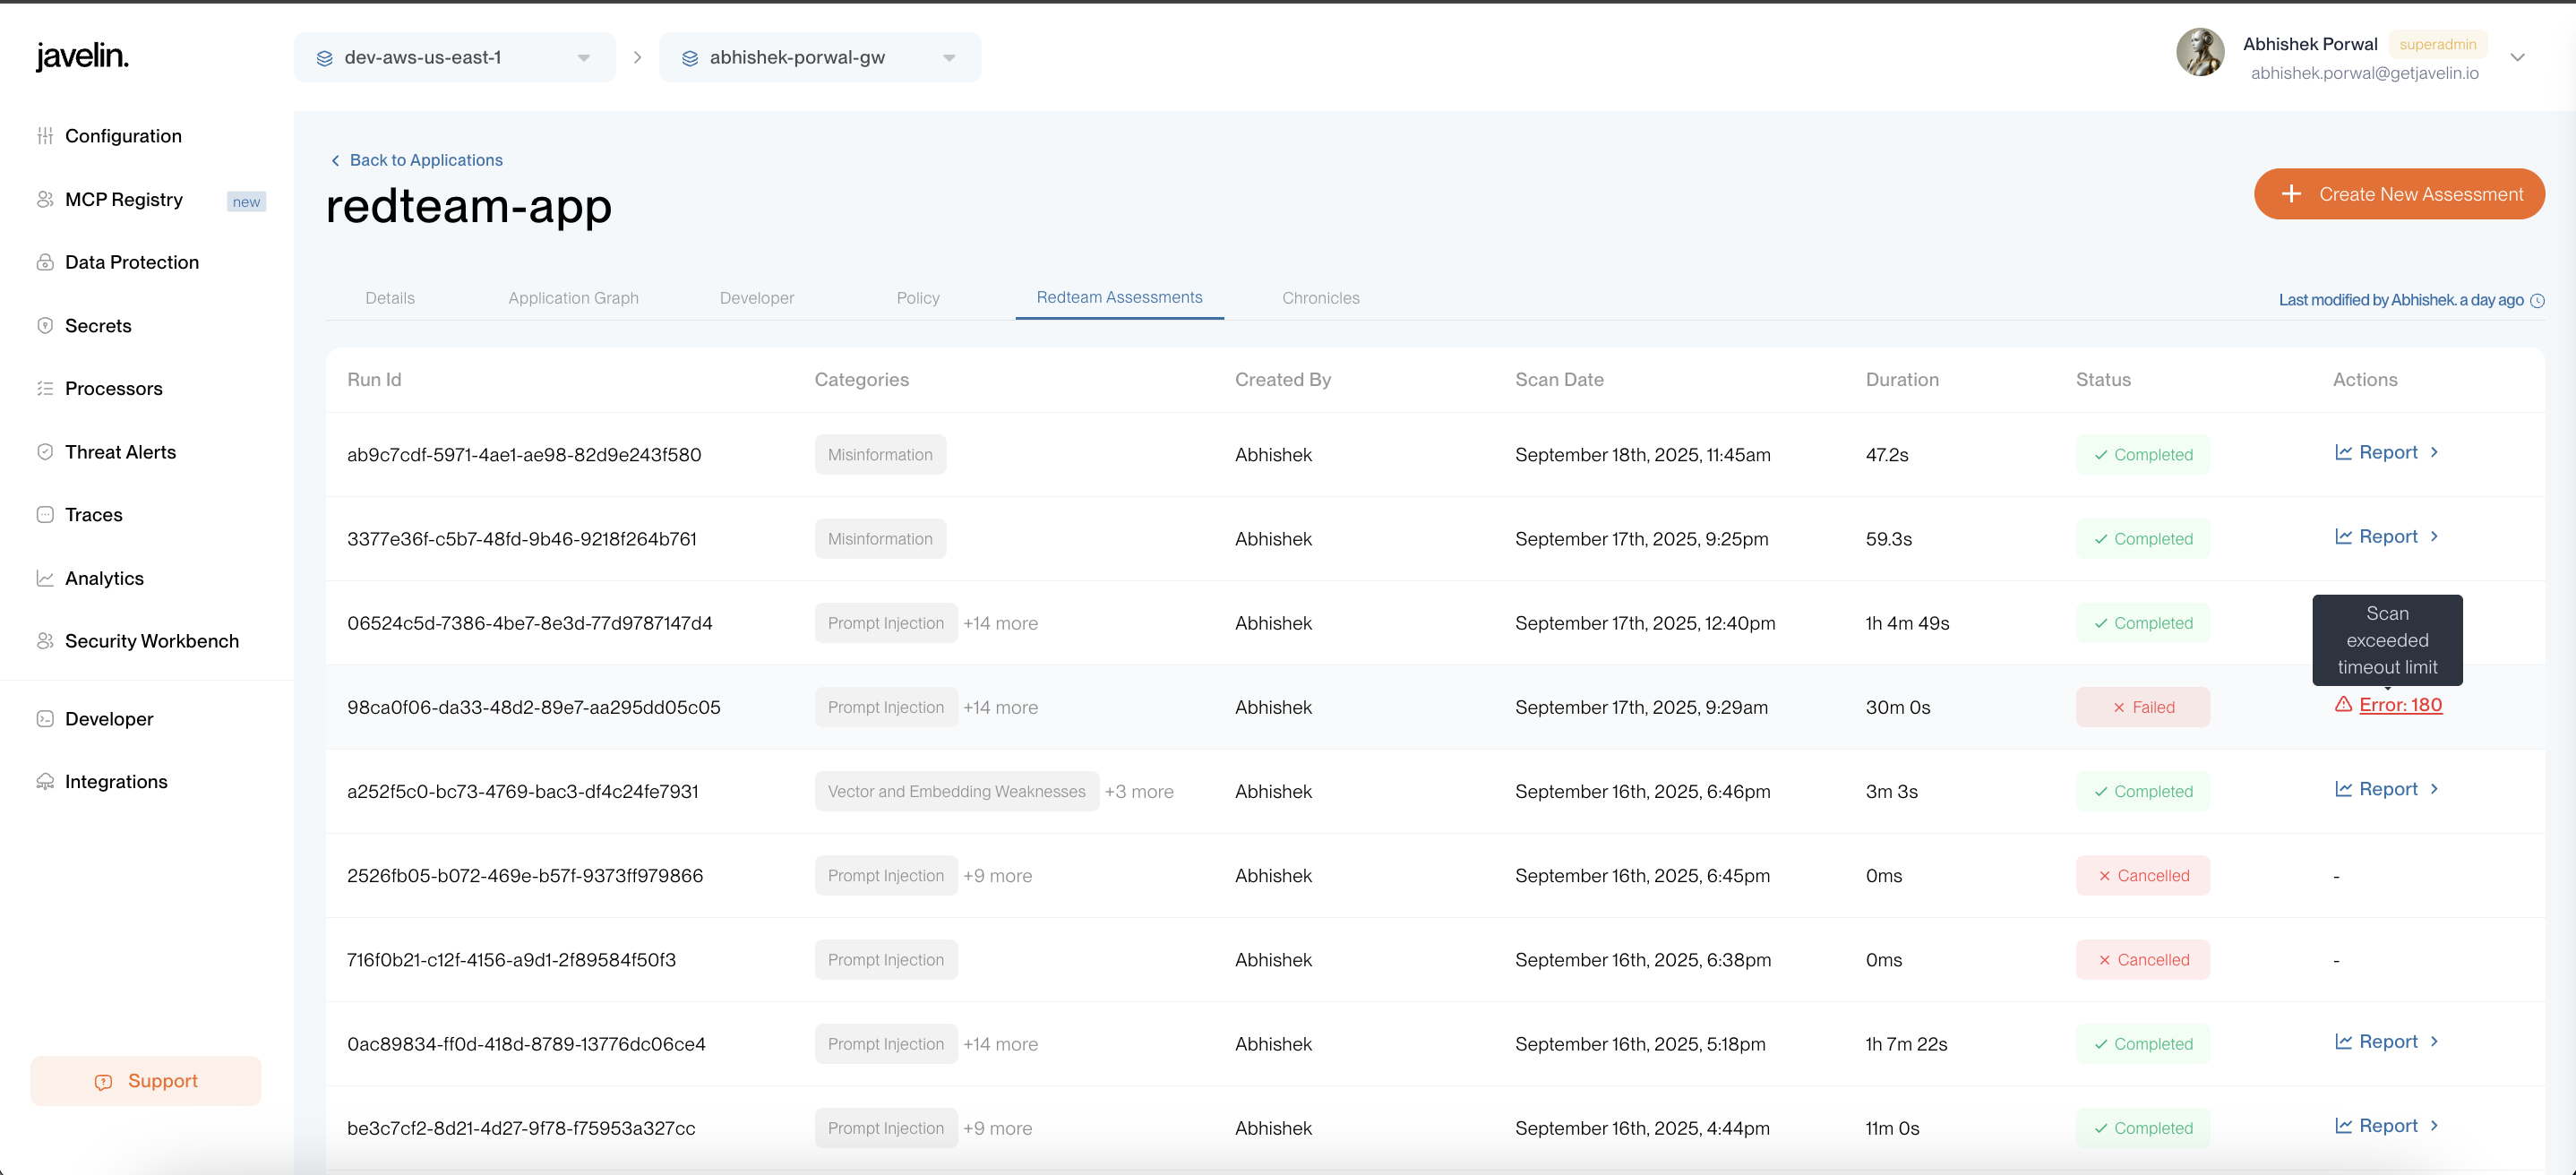
Understanding Failed Scans
If a scan fails for any reason, an error code will be displayed in the Actions column of the scan table.
Quick Error Information
- Hover over the error icon to view a quick description
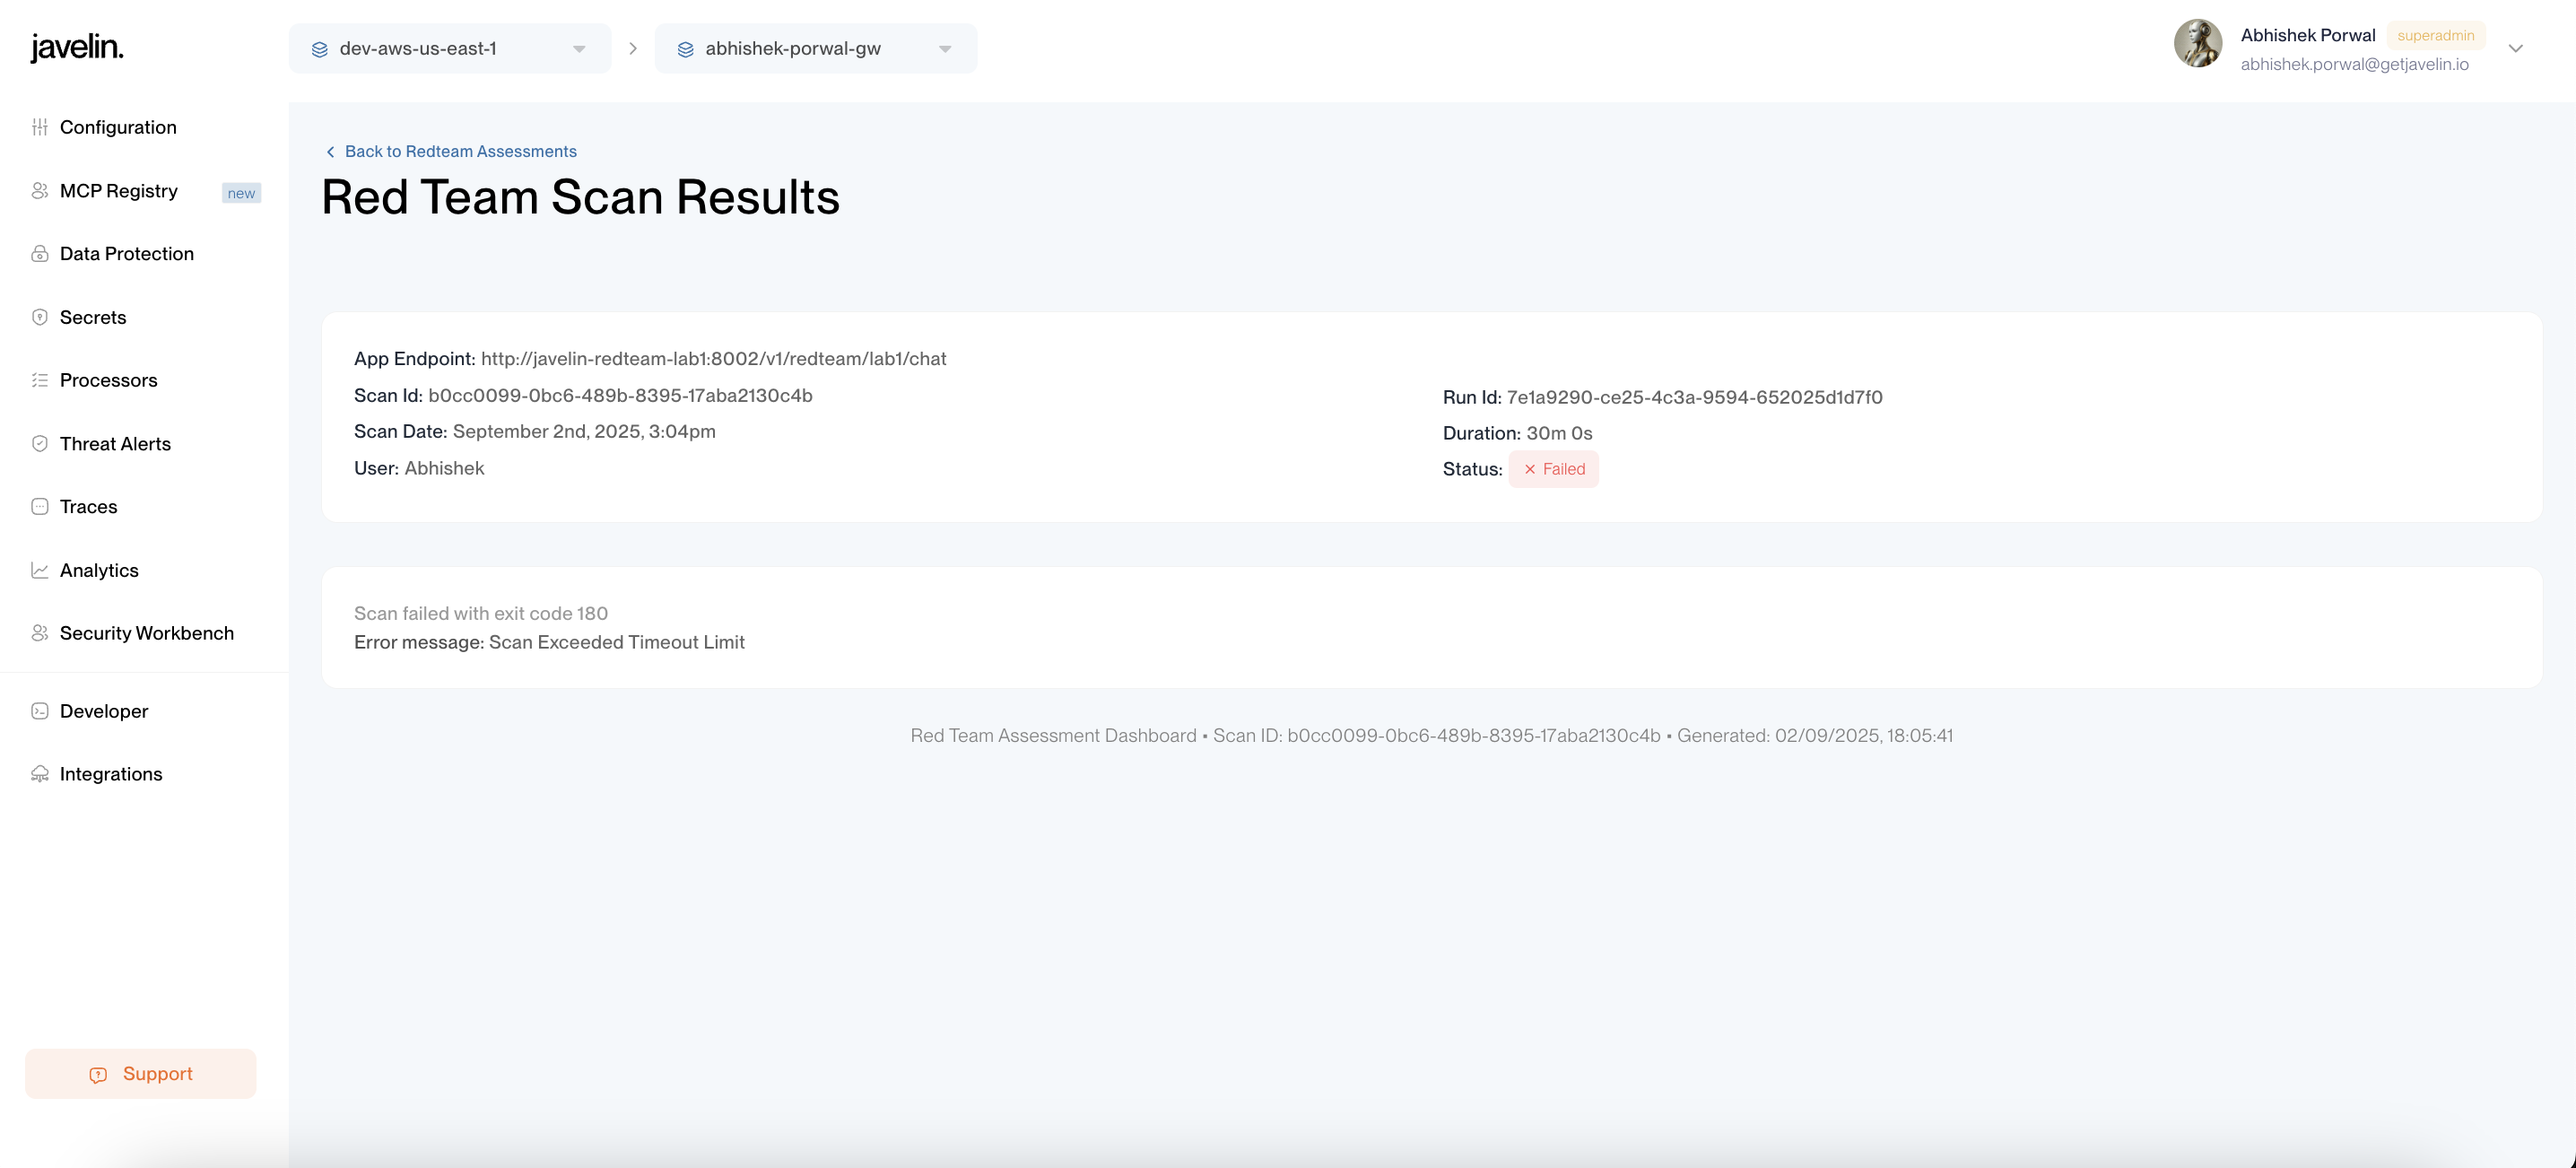
Detailed Error Information
- Click on Report to open the detailed scan report view
In the report view, you'll find:
- Scan configuration details
- Error code
- Full error description
Scan Exit and Error Codes
When a scan completes (successfully or with failure), it returns an exit code that indicates the outcome. These codes follow Unix/Linux conventions where 0 indicates success and non-zero values indicate various types of errors.
Exit Code Categories
| Code Range | Category | Description |
|---|---|---|
| 0 | Success | Scan completed successfully |
| 100-103 | Resource Errors | Memory, disk space, CPU, or concurrency limits |
| 113-114 | Generic Errors | Unidentified or internal system errors |
| 120-123 | Authentication/Authorization | API keys, permissions, or authentication issues |
| 131-135 | Configuration Errors | Invalid scan parameters or configuration |
| 140-144 | Network/Connection | Network timeouts, DNS, SSL, or proxy issues |
| 160-163 | Target Application | Target service errors, rate limiting, or unavailability |
| 170-173 | System Errors | Database, Redis, file system, or permission issues |
| 180-186 | Scan Execution | Timeouts, agent failures, or worker process issues |
Common Exit Codes
| Code | Name | Description | Common Cause |
|---|---|---|---|
| 0 | SUCCESS | Scan completed successfully | Everything worked perfectly |
| 180 | SCAN_TIMEOUT | Scan exceeded timeout limit | Most common failure - scan took too long |
| 141 | CONNECTION_FAILED | Failed to connect to target | Target application unreachable |
| 131 | INVALID_CONFIG | Scan configuration is invalid | Check your scan configuration |
| 120 | AUTHENTICATION_FAILED | Failed to authenticate with target | Verify API keys and credentials |
| 186 | WORKER_PROCESS_KILLED | Worker process was terminated | Usually indicates timeout or resource limits |
Quick Troubleshooting Guide
| If you see... | Try this... |
|---|---|
| 180, 181 | Reduce timeout or maxScenarios in scan config |
| 141, 142 | Check target endpoint URL and network connectivity |
| 120, 163 | Verify API keys and authentication credentials |
| 131-135 | Review scan configuration parameters |
| 100-103 | Reduce scan scope or wait for resources |
For a complete list of all exit codes, refer to the API documentation or contact support.
Next Steps
After successfully monitoring and completing your scan:
- Review Results: Check the Understanding Reports Guide for detailed analysis
- Remediate Issues: Address identified vulnerabilities based on severity
- Schedule Regular Scans: Integrate red team assessments into your security workflow