Guardrail Bypass
Automatic Detection of Broken or Misconfigured Guardrails
Javelin automatically tracks and surfaces requests that fail due to Guardrail misconfigurations or enforcement errors, helping security and platform teams proactively address policy blind spots.
🚨 What Triggers a Guardrail Failure?
Guardrail processing can fail due to several reasons:
- Processor Misconfiguration: Incorrect settings or missing parameters in the guardrail definition
- Internal Processing Errors: Unexpected runtime issues within the guardrail execution logic
- Missing Dependencies: Unlinked data sources, broken policy references, or unsupported model configurations
- Endpoint Failure: The system was unable to resolve or reach the upstream endpoint associated with a guardrail processor. This typically occurs when:
- The configured processor points to an invalid or non-existent domain
- The route or service backing the guardrail is not registered or unavailable
- There’s a DNS resolution failure, network partition, or missing internal service dependency
These failures are classified with error codes like GUARDRAIL_CONFIGURATION, GUARDRAIL_ENDPOINT_UNREACHABLE, etc. and are:
- Logged in the trace metadata for full visibility
- Accessible from the Threat Alerts → Requests With Guardrail Failure dashboard
- Useful for debugging misrouted or unresponsive services during guardrail evaluation
📘 Guardrail Error Types & Classification
To help teams rapidly diagnose and resolve issues, all guardrail failures are now classified using structured error codes with associated user-friendly messages.
Each failure is also tagged with a metric key to support detailed observability and alerting.
🧰 Configuration Errors
| Error Code | Description | User Message |
|---|---|---|
GUARDRAIL_CONFIGURATION_INVALID | Invalid or malformed configuration | Guardrail configuration is invalid |
GUARDRAIL_CONFIGURATION_MISSING | Required configuration not provided | Required guardrail configuration is missing |
GUARDRAIL_CONFIGURATION_MISMATCH | Conflicting configuration or incompatible setup | Guardrail configuration mismatch detected |
🌐 Endpoint Errors
| Error Code | Description | User Message |
|---|---|---|
GUARDRAIL_ENDPOINT_UNREACHABLE | Endpoint cannot be reached due to DNS or network errors | Guardrail service endpoint is not reachable |
GUARDRAIL_ENDPOINT_INVALID | Misconfigured or malformed endpoint URL | Guardrail service endpoint is invalid |
GUARDRAIL_ENDPOINT_NOT_FOUND | Endpoint is undefined or unavailable | Guardrail service endpoint not found |
GUARDRAIL_ENDPOINT_AUTH_FAILED | Invalid or missing auth credentials | Guardrail service authentication failed |
GUARDRAIL_TIMEOUT_CONNECTION | Connection timed out or was aborted | Guardrail service connection timed out |
🔧 Service-Level Failures
| Error Code | Description | User Message |
|---|---|---|
GUARDRAIL_SERVICE_UNAVAILABLE | Service temporarily unavailable or restarting | Guardrail service is temporarily unavailable |
GUARDRAIL_SERVICE_RATE_LIMITED | Guardrail backend is being throttled | Guardrail service rate limit exceeded |
GUARDRAIL_SERVICE_INTERNAL_ERROR | Unexpected internal server issue | Guardrail service encountered an internal error |
🌀 General Errors
| Error Code | Description | User Message |
|---|---|---|
GUARDRAIL_GENERAL | Unclassified but known error | Guardrail service encountered an error |
GUARDRAIL_UNKNOWN | Unknown or uncategorized error | Unknown guardrail error occurred |
📊 Metrics & Observability
Each error is emitted with a metric key (e.g., guardrail_error_configuration_invalid, guardrail_error_endpoint_unreachable, etc.), enabling teams to:
- Track the frequency and category of failures
- Set up alerts for high-error conditions
- View the alerts in the threat dashboards to visualize the application health
This structured classification gives you a consistent way to debug, alert, and remediate guardrail issues in production environments.
🧭 Where to Find These Failures
You can view all Guardrail-related failures in a centralized location:
- Threat Alerts → Requests With Guardrail Failure
This enables your security teams to:
- Quickly identify and triage misconfigured guardrails
- Audit gaps in policy enforcement
- Take corrective action before these failures lead to inconsistent behavior or security loopholes
More detail for Guardrail failure in Traces attributes:
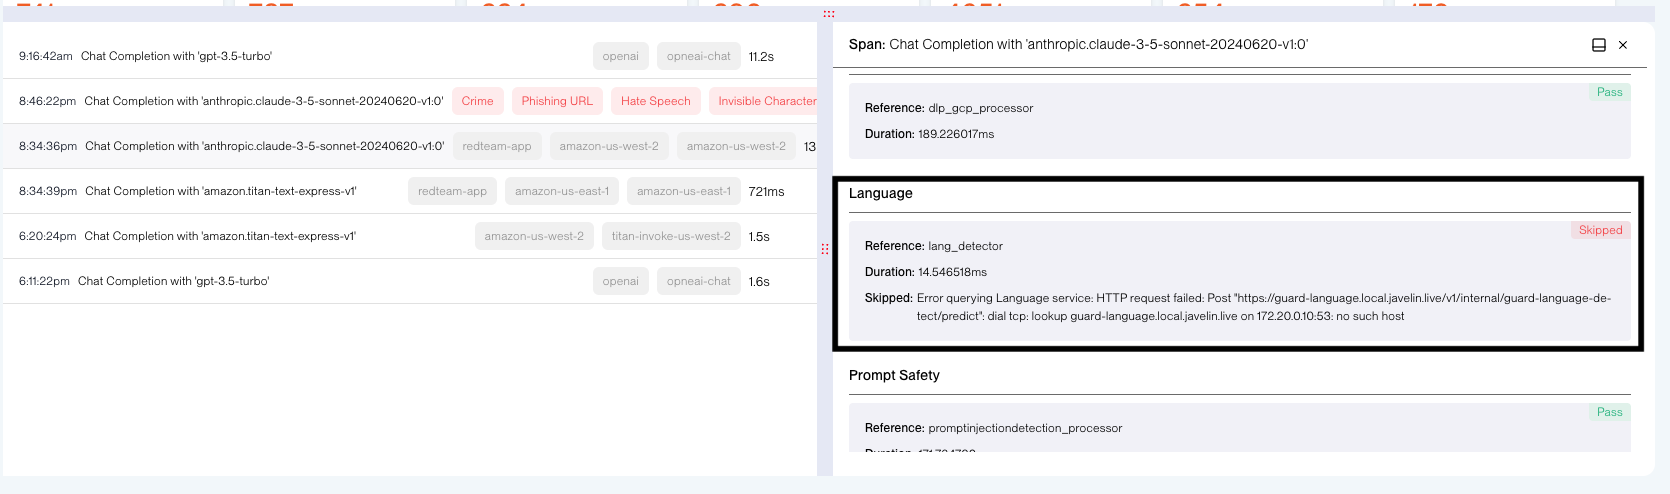
🔍 Trace-Level Insight for Each Failure
Guardrail failures are also surfaced directly within the Attributes section on the Traces / Threat Page.
You’ll see detailed failure metadata, such as:
- The name of the failing guardrail processor
- The reason for failure (e.g., config issue, timeout, internal error)
- Timestamp and route context
- Policy or model references that caused the failure
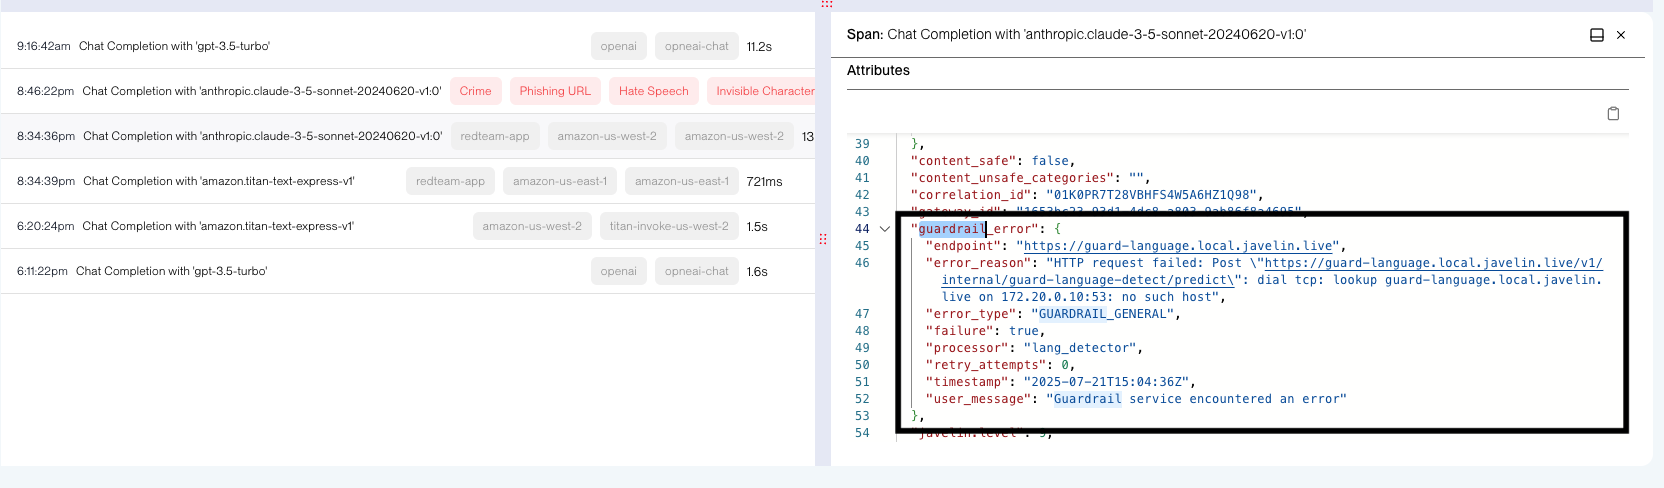
Example:
{
"guardrail_error": {
        "endpoint": "https://guard-language.local.javelin.live",
        "error_reason": "HTTP request failed: Post \"https://guard-language.local.javelin.live/v1/internal/guard-language-detect/predict\": dial tcp: lookup guard-language.local.javelin.live on 172.20.0.10:53: no such host",
        "error_type": "GUARDRAIL_ENDPOINT_UNREACHABLE",
        "failure": true,
        "processor": "lang_detector",
        "retry_attempts": 0,
        "timestamp": "2025-07-21T15:04:36Z",
        "user_message": "Guardrail service encountered an error"
    }
}