Application Guides
This guide explains how to create and manage Applications in Javelin, generate and use API keys, apply application-level policies, review request logs in Chronicles.
Creating an Application
-
Navigate to the Applications page within your gateway.
-
From the sidebar, open Configuration.
-
Click Create New Application button.
-
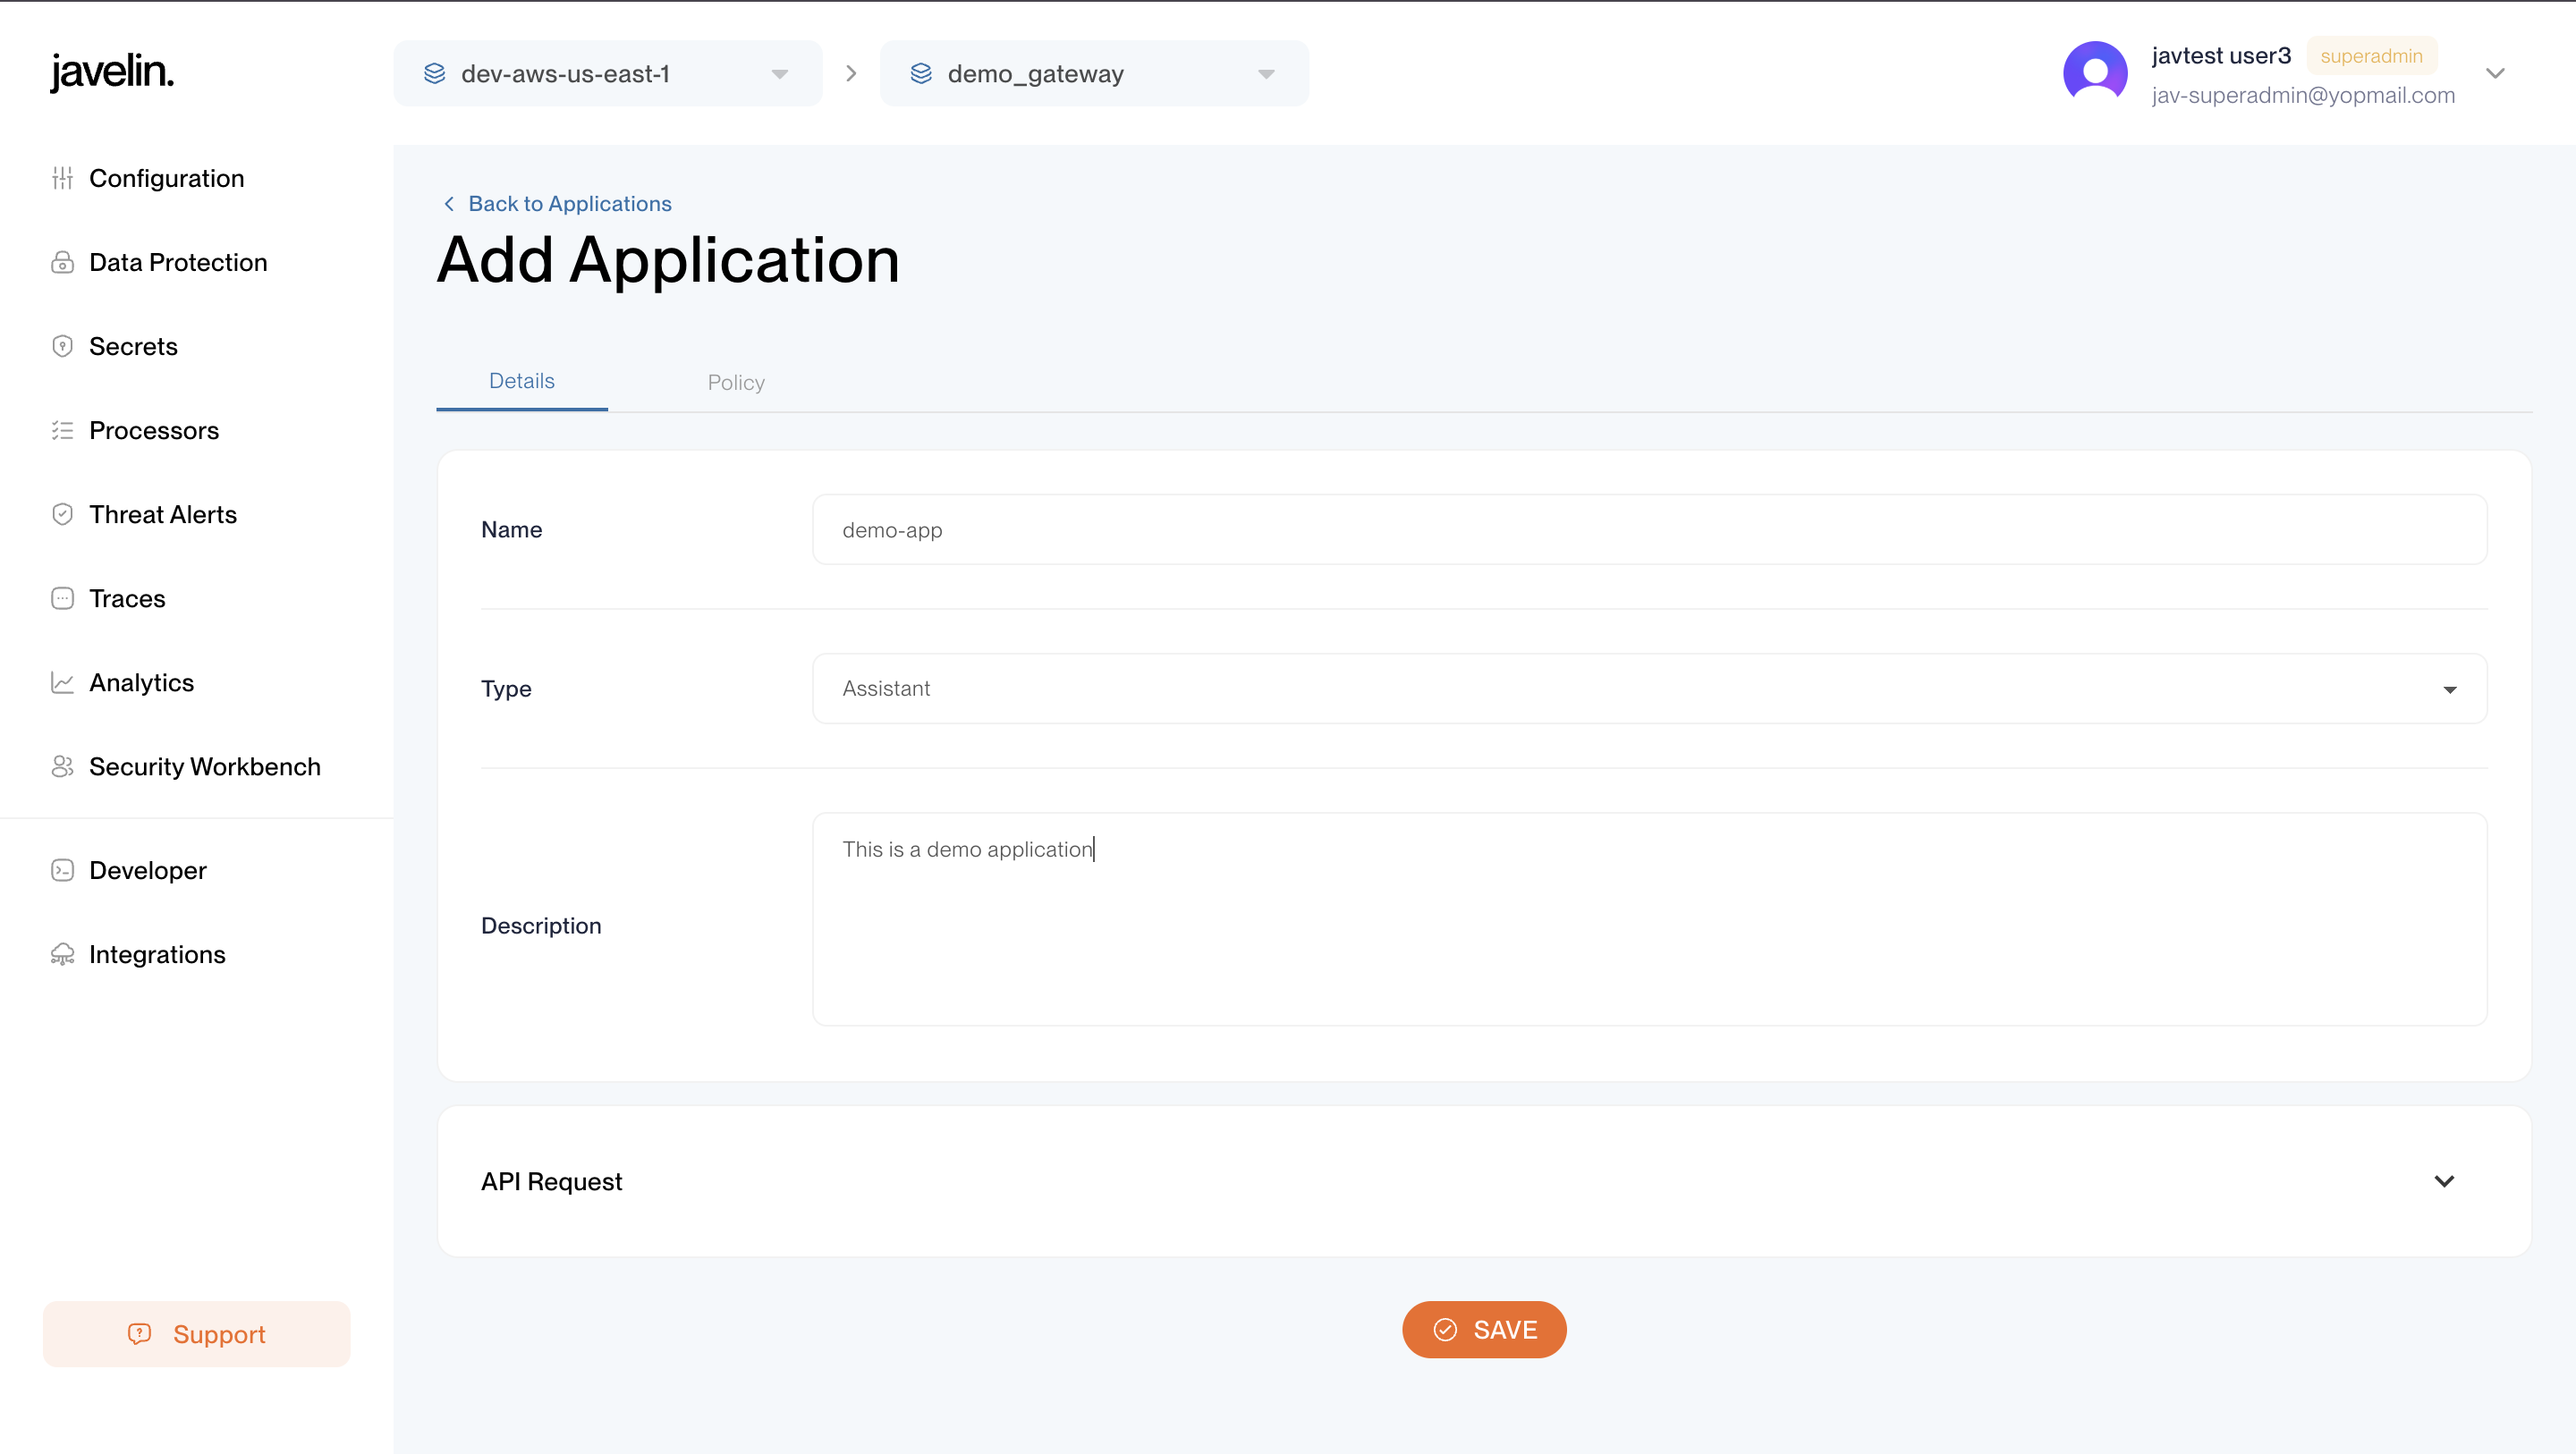
Enter the following details in the Details tab:
- Name – Unique identifier for your application.
- Type – Application type (Assistant, Agent, Custom).
- Description – A human-readable purpose for your application.
- API Request – This configuration is used for RedTeam Scans. For detailed setup instructions, refer to the RedTeam Guide.
Note: You can create the application without this information initially, but it must be updated before running a RedTeam Scan.
-
Click Save.
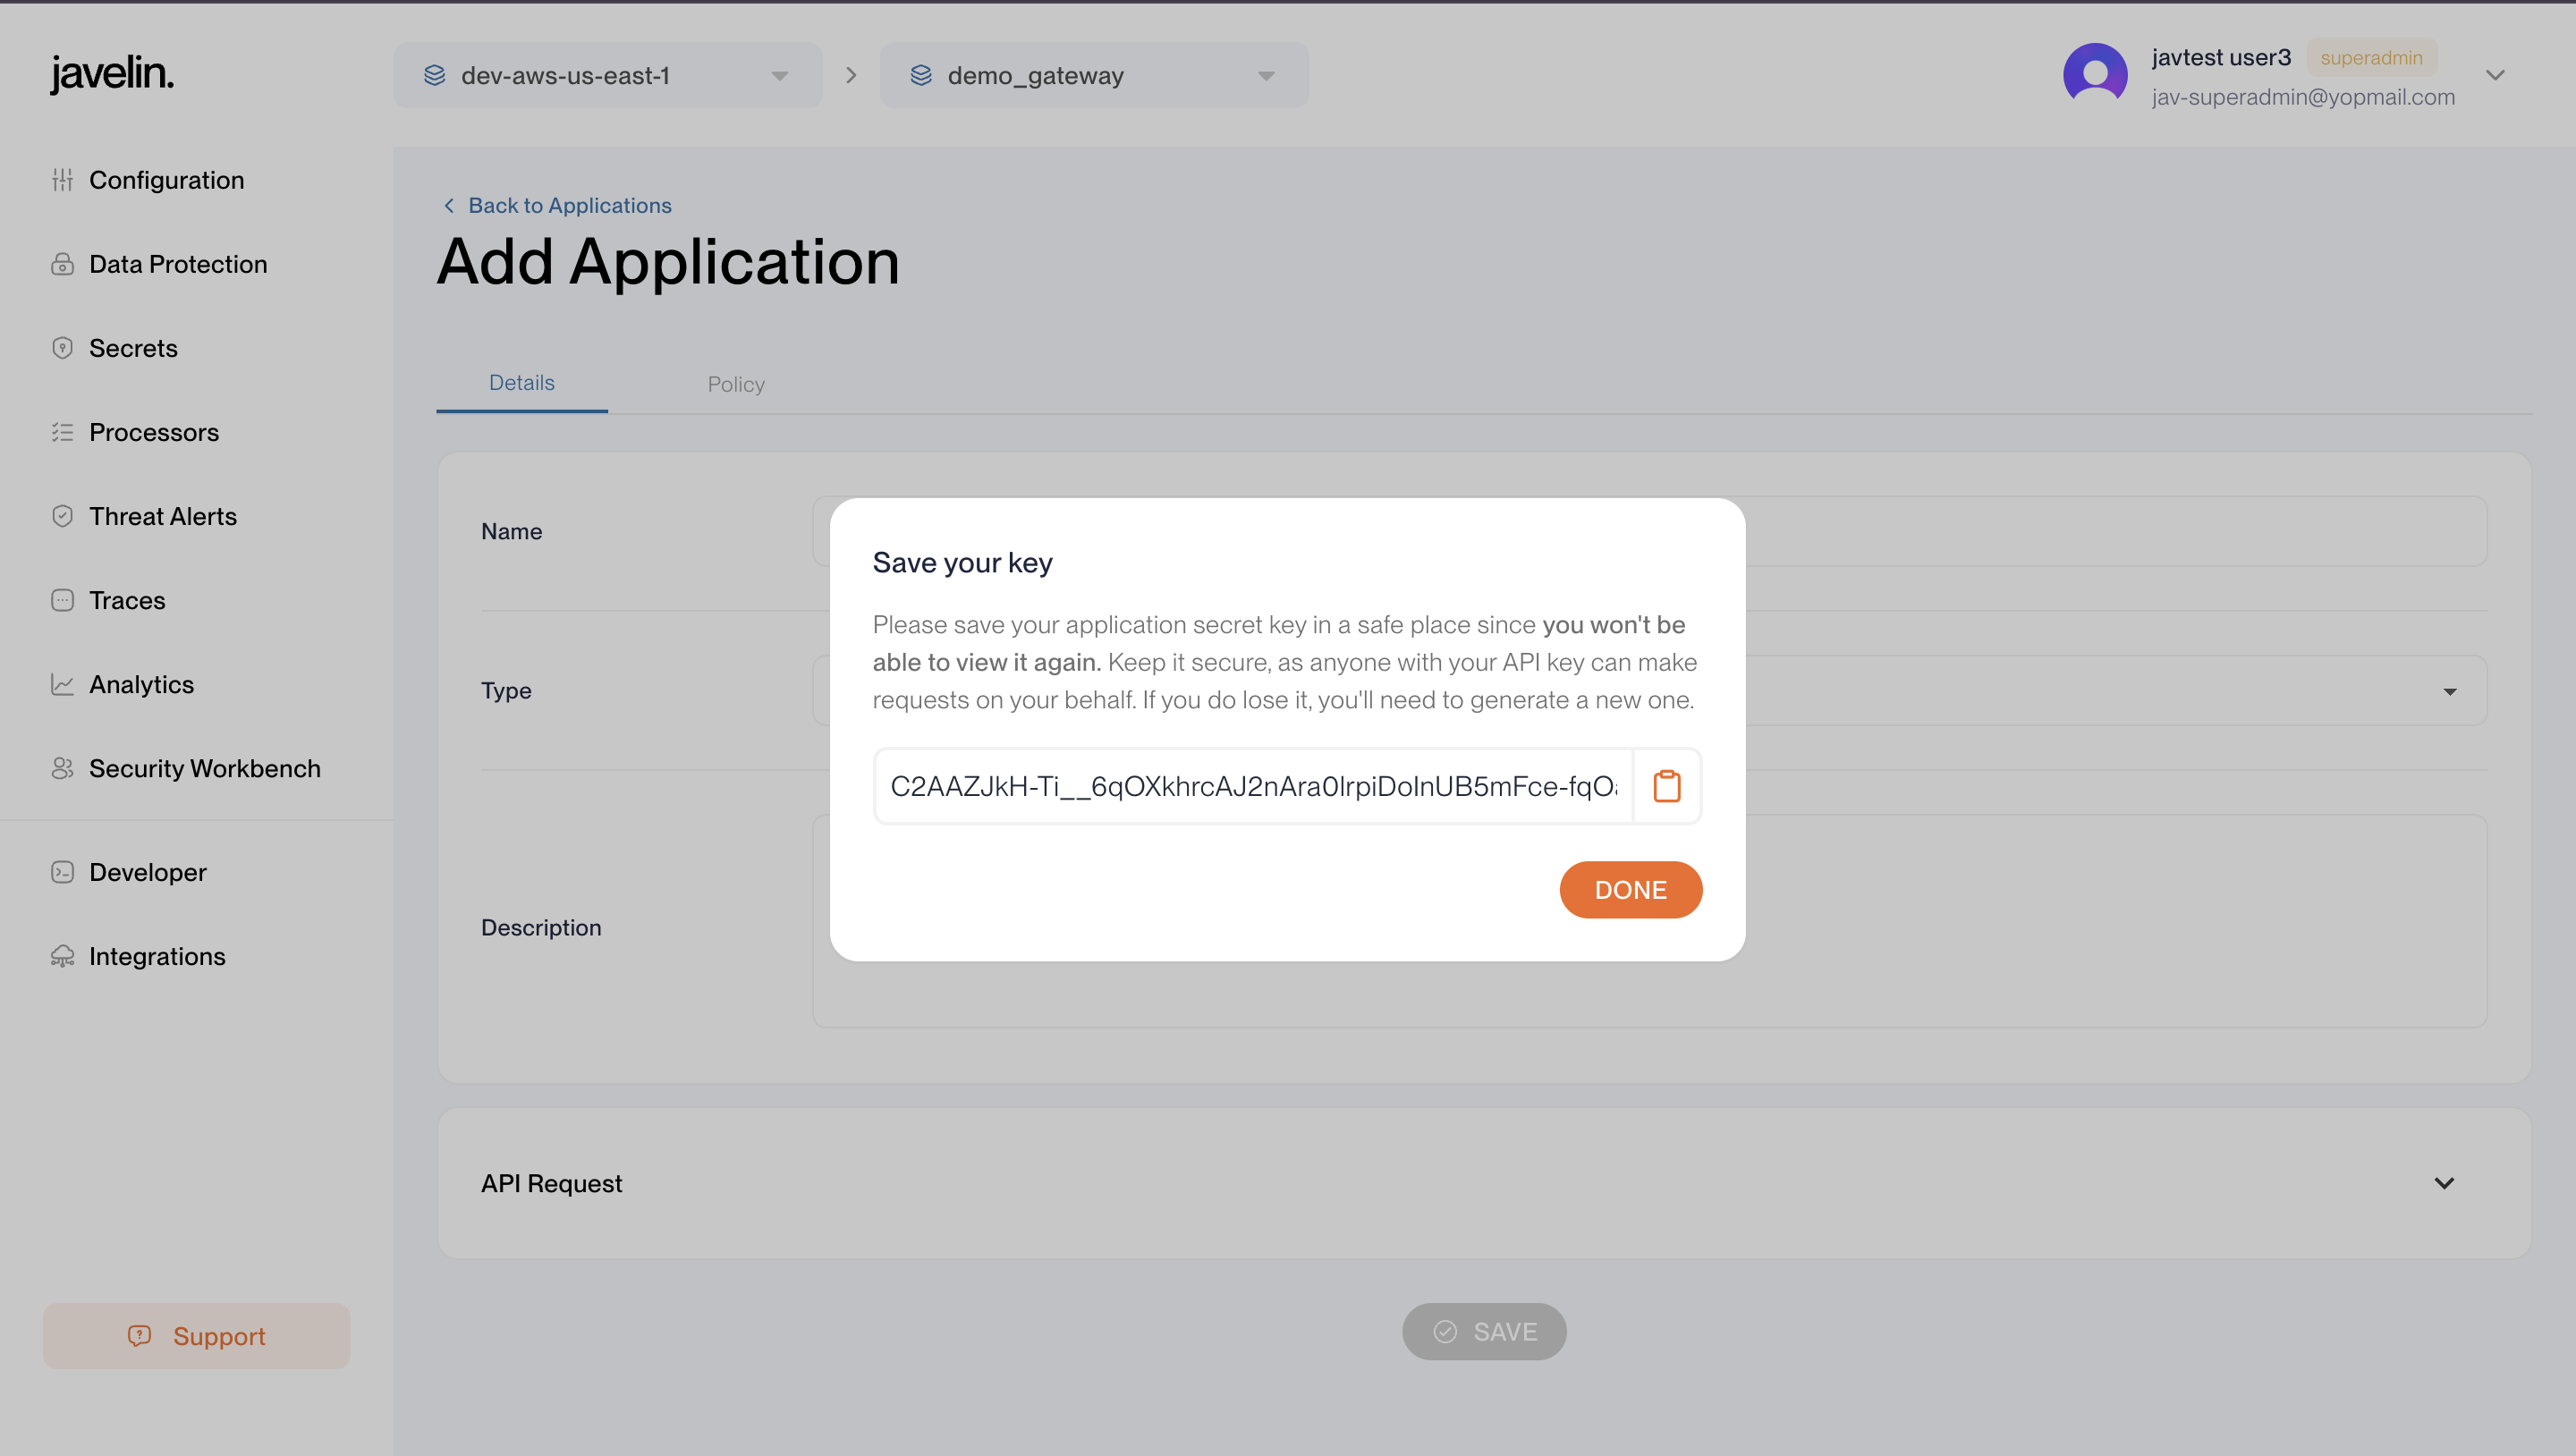
Once Application is created:
- A Developer Key is automatically generated.
- This is a one time visible key, right after creation. Immediately copy and store it somewhere safe, as later you’ll only see a masked version of it.
- This key needs to be passed in the
X-Javelin-Apikeyheader for any route request.
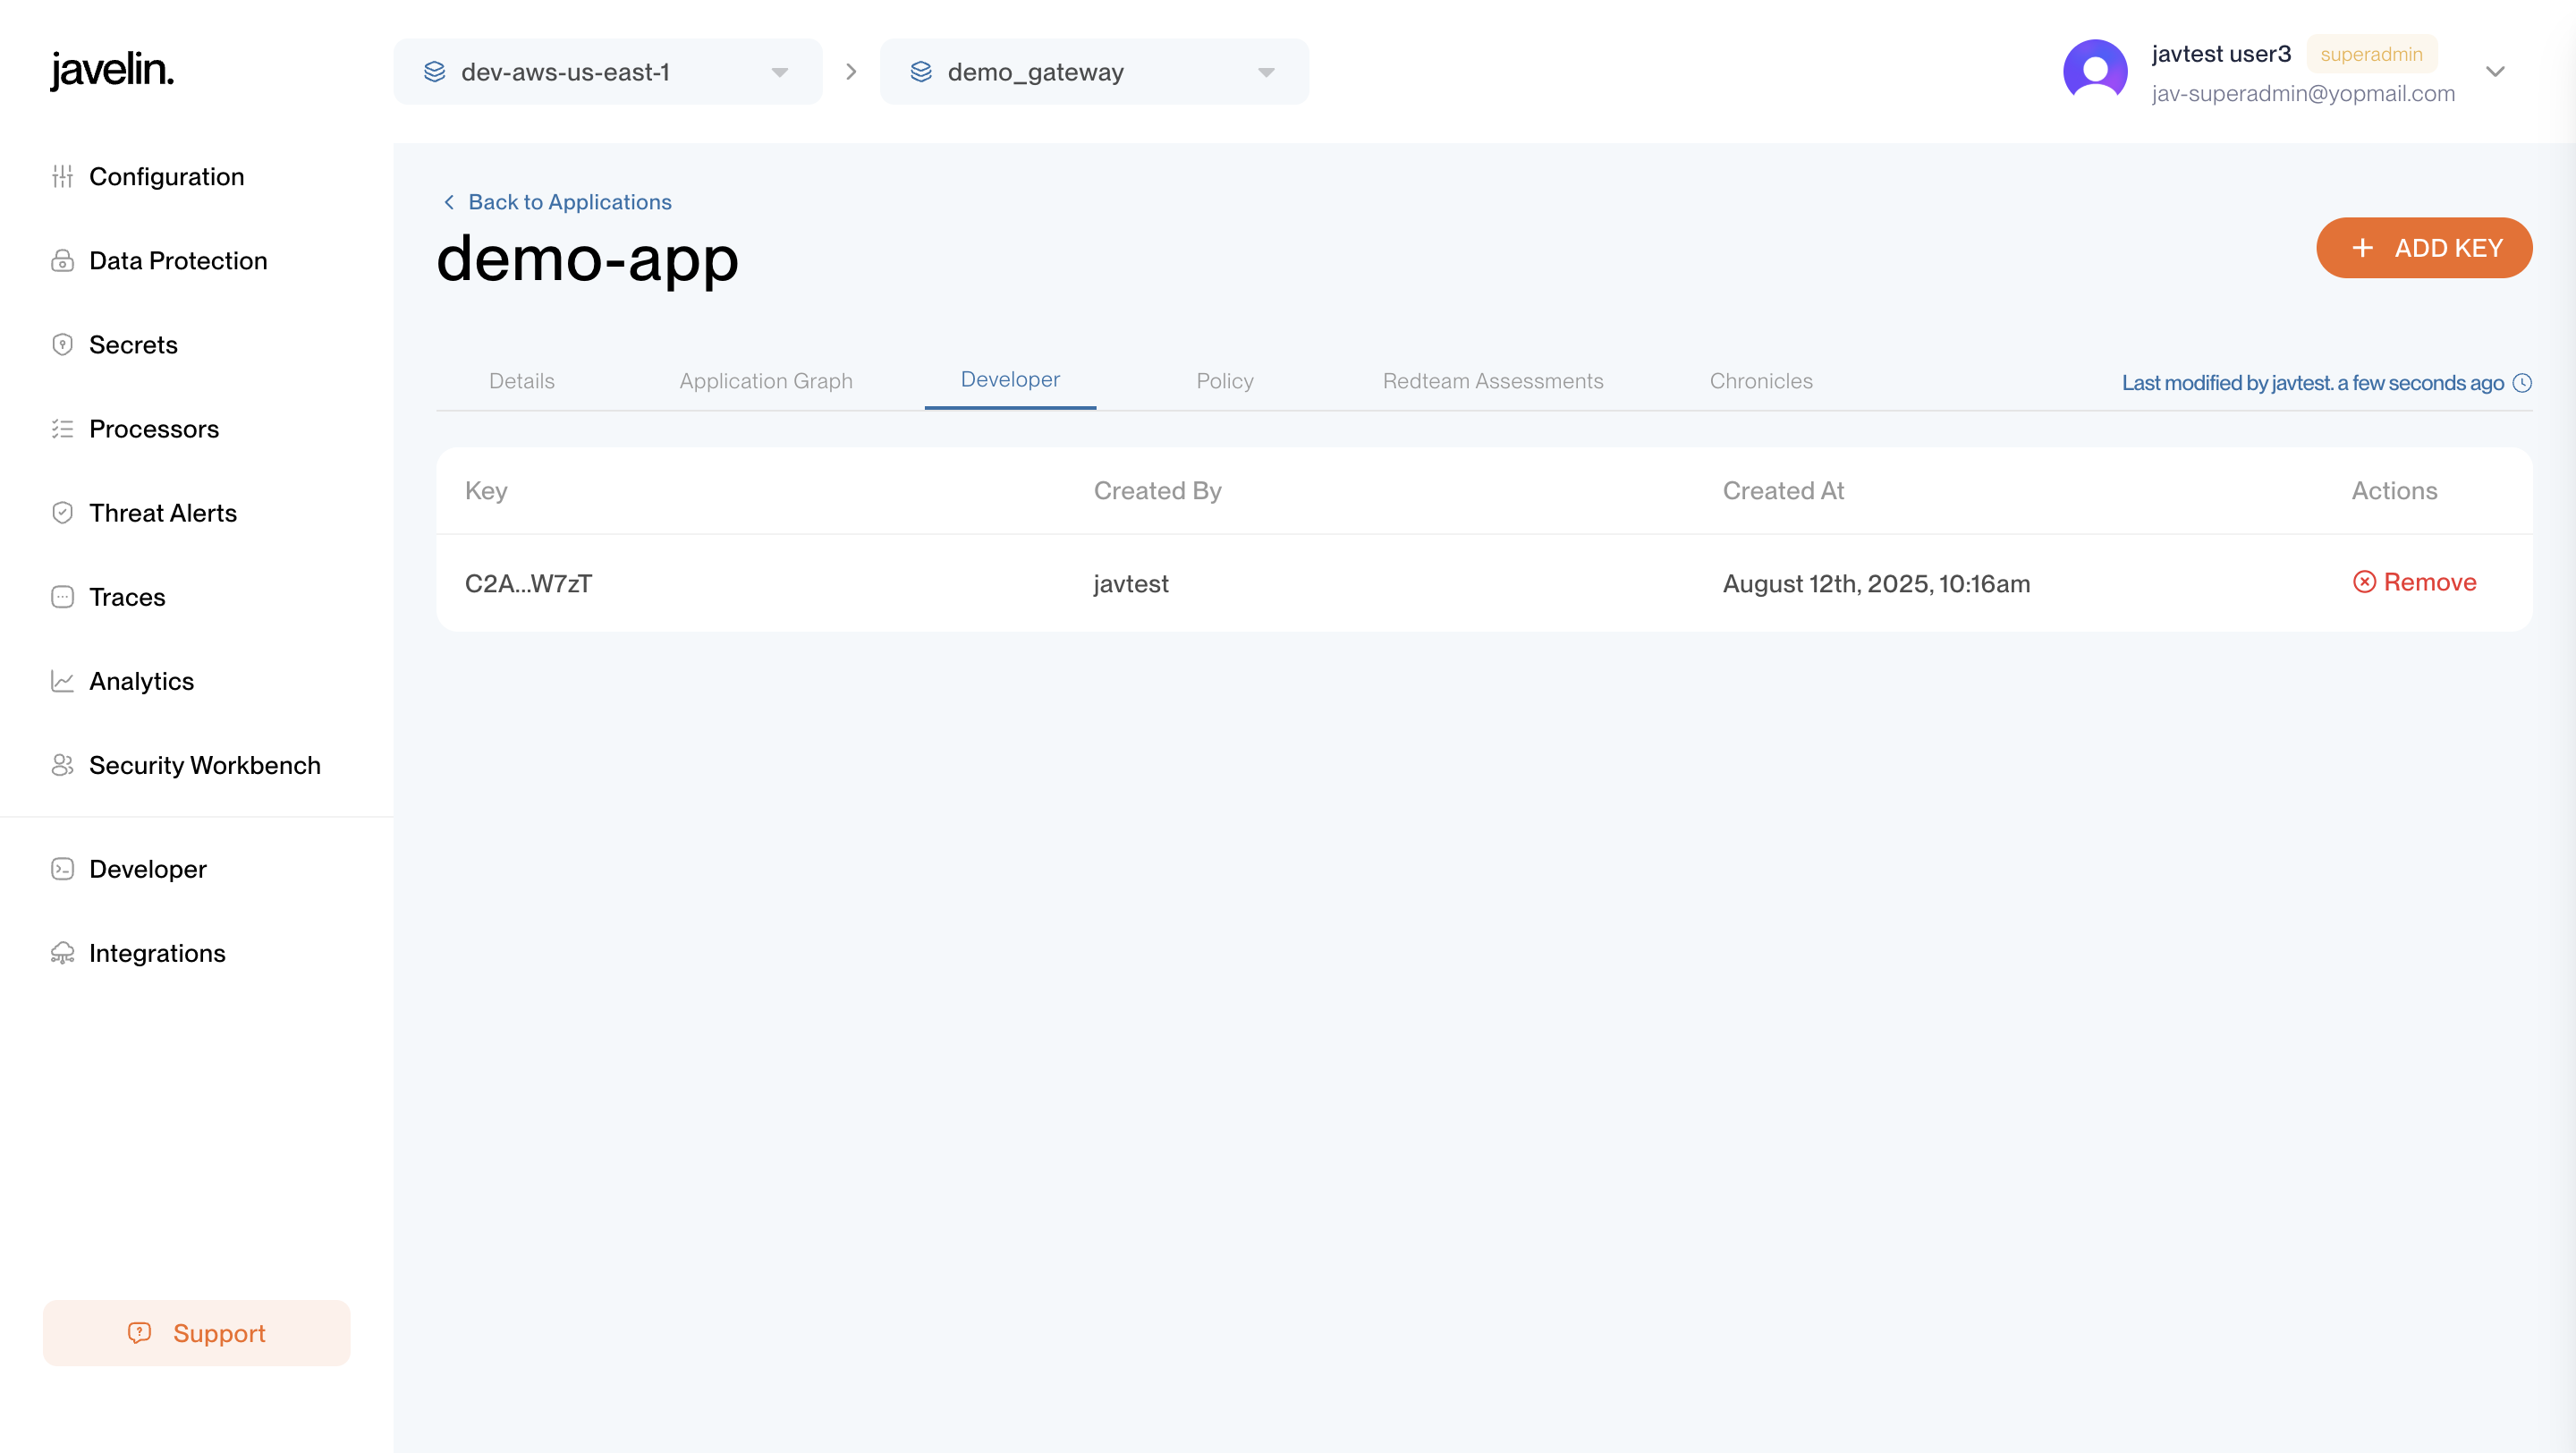
Developer Tab
The Developer tab allows you to:
- View all keys of the application.
- Generate new keys by clicking Add Key.
- Delete any API key in-case it is compromised.
Usage:
For any request made through a route, include your Application API key in the header:
-H "X-Javelin-Apikey: <APPLICATION_API_KEY>"
This key authorizes requests and ensures activity is logged under your application.
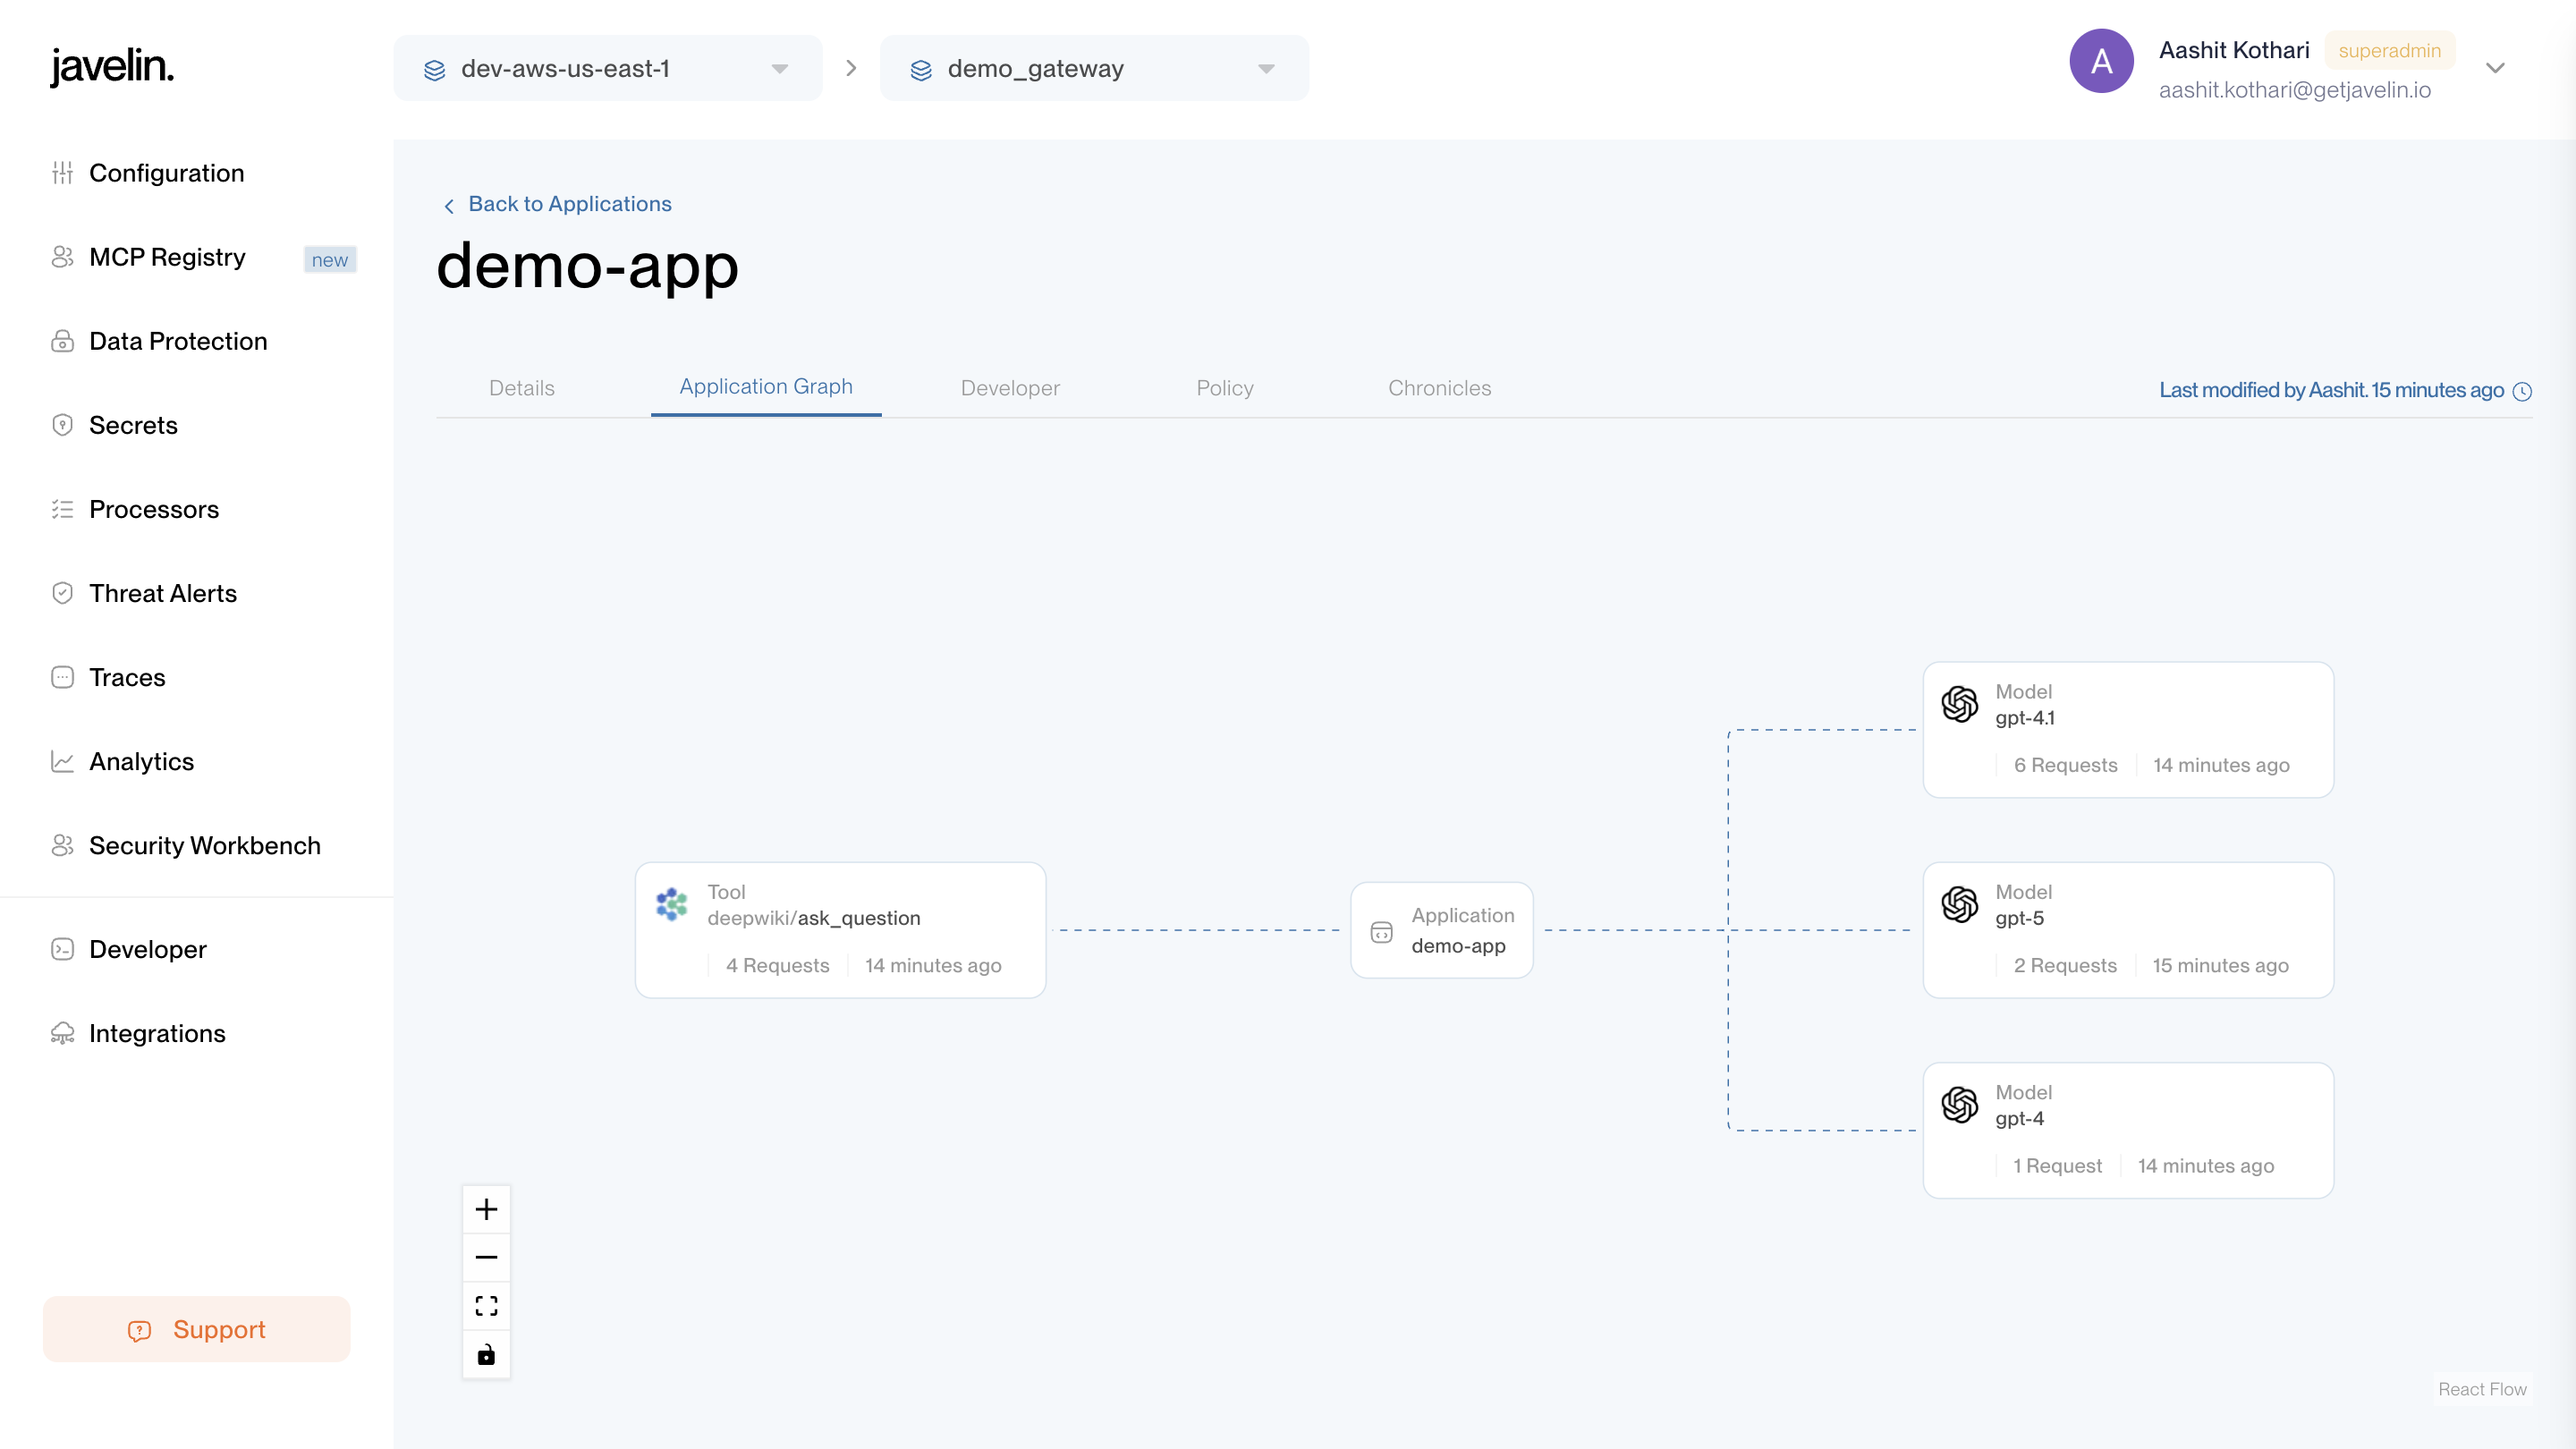
Application Graph Tab
The Application Graph tab provides a visual overview of how your Application Key is being used across both LLM models and MCP registries.
- On the left side of the graph, all MCP registries are displayed, showing which tools have been invoked through them.
- Each registry expands to show the tools invoked under it (with tool names visible).
- On the right side, all LLM models accessed with this application key are shown.
- For each model or MCP registry, you can see:
- Name (model name or MCP server label)
- Number of requests
- Last used timestamp
This dual view helps you:
- Track usage of MCP tools and LLM models.
- Identify which models or registries generate the most activity.
- Analyze traffic distribution across models and MCP servers.
For more details on how MCP works in Javelin, see the MCP Overview.
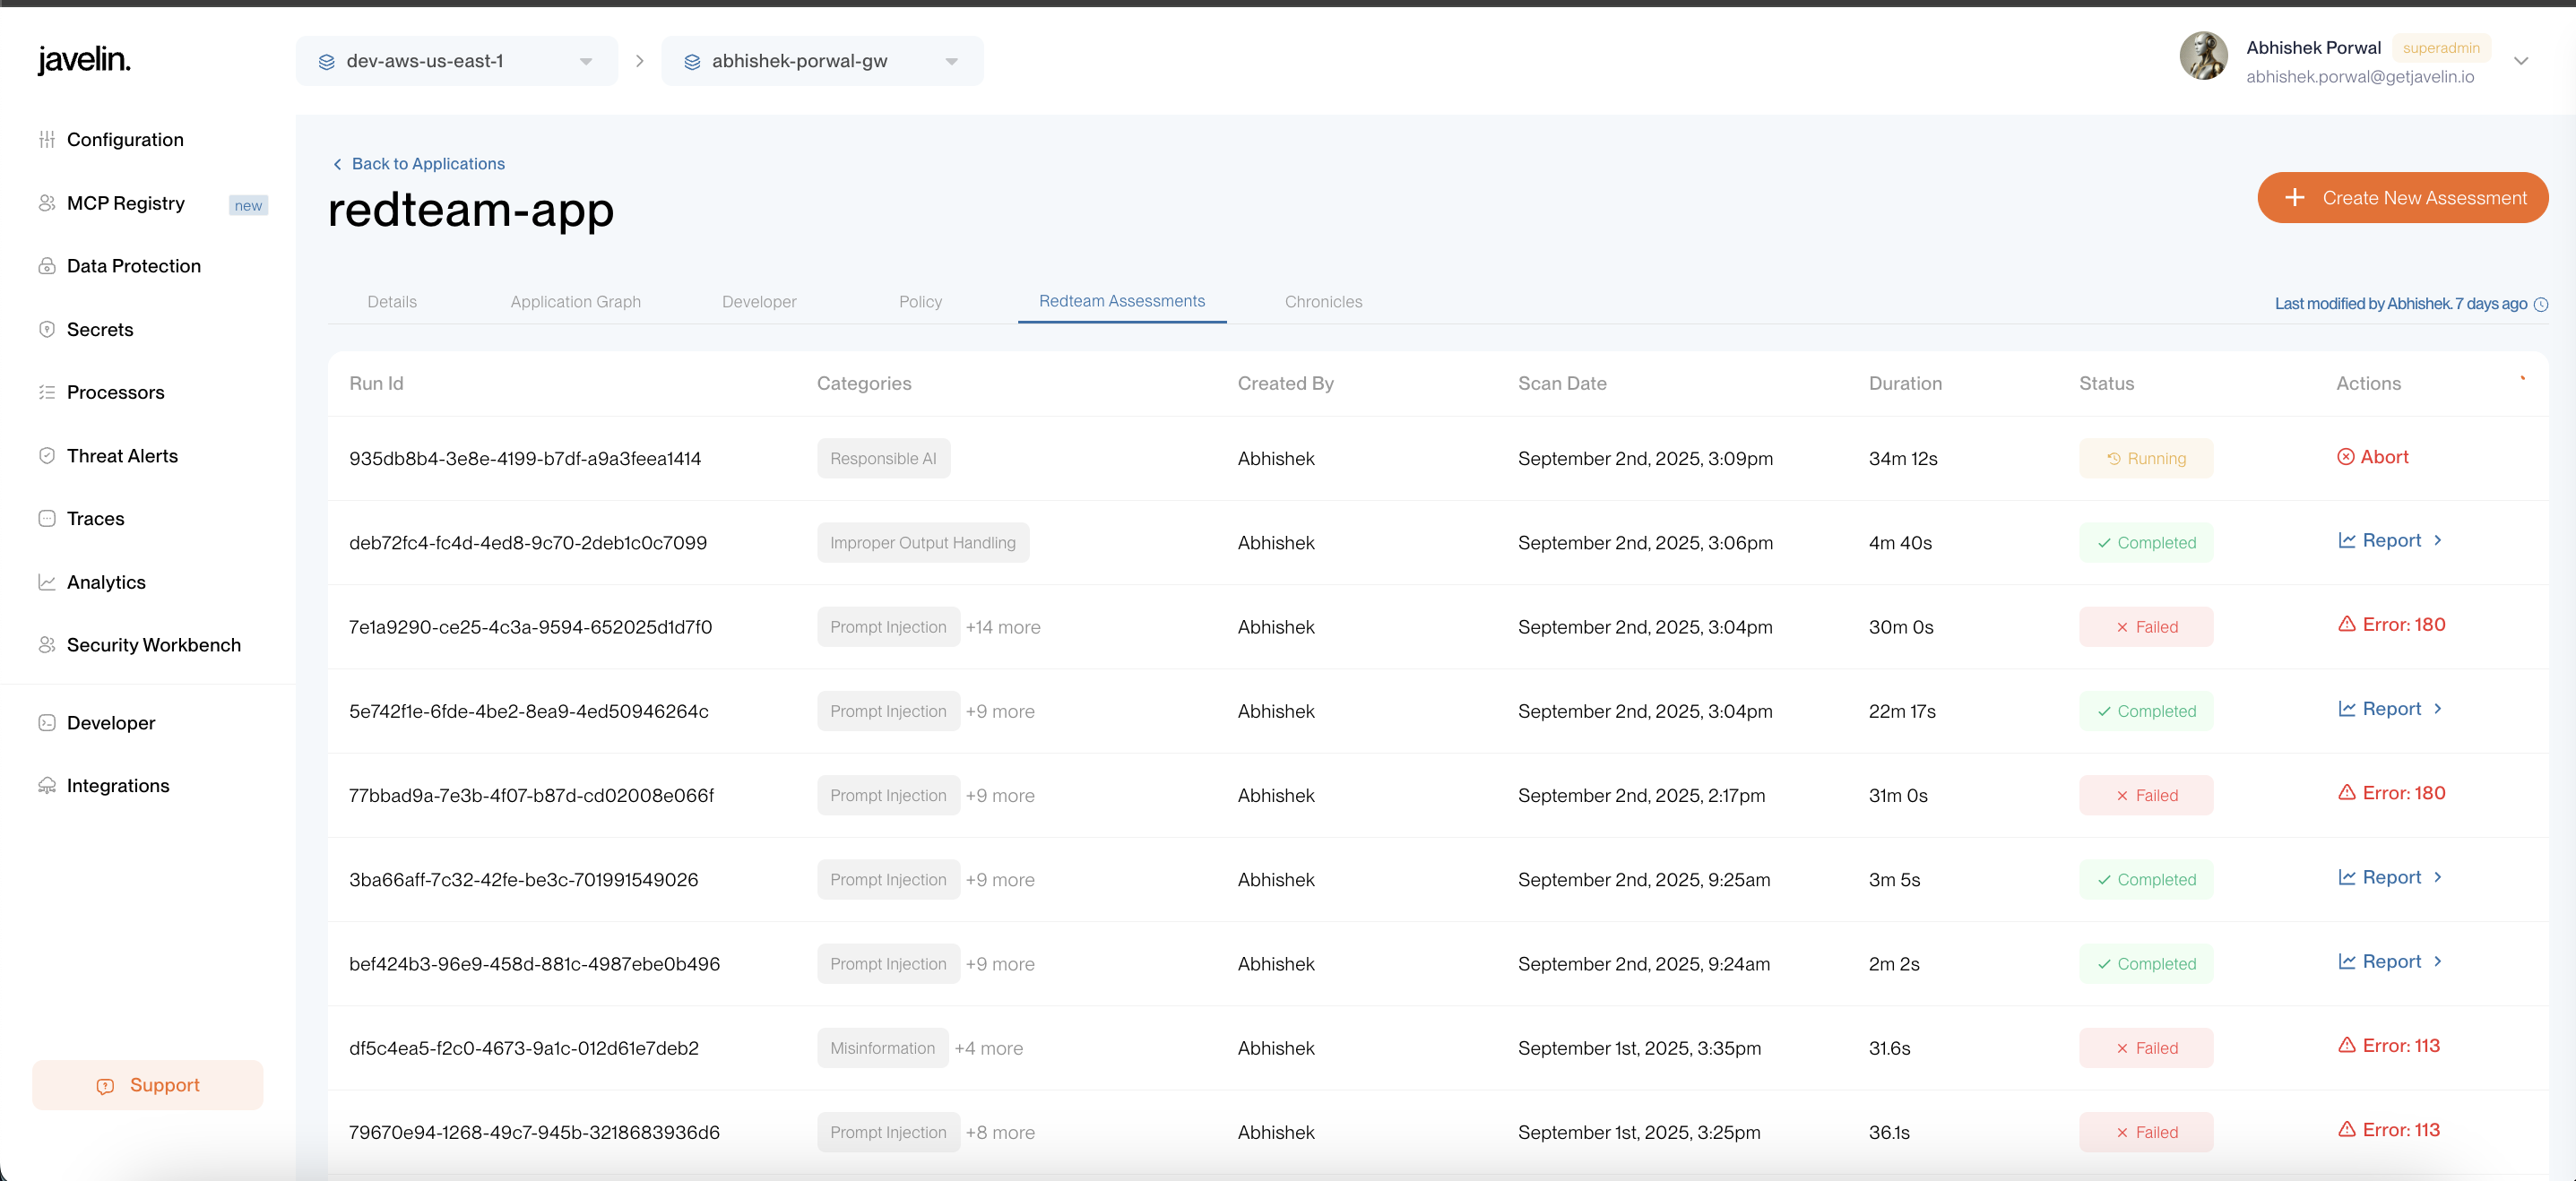
Redteam Assessment Tab
- Displays any red team security assessments performed against this application.
- Allows tracking of vulnerabilities, model behavior checks, and evaluation results.
- For complete overview, see Javelin RedTeam.
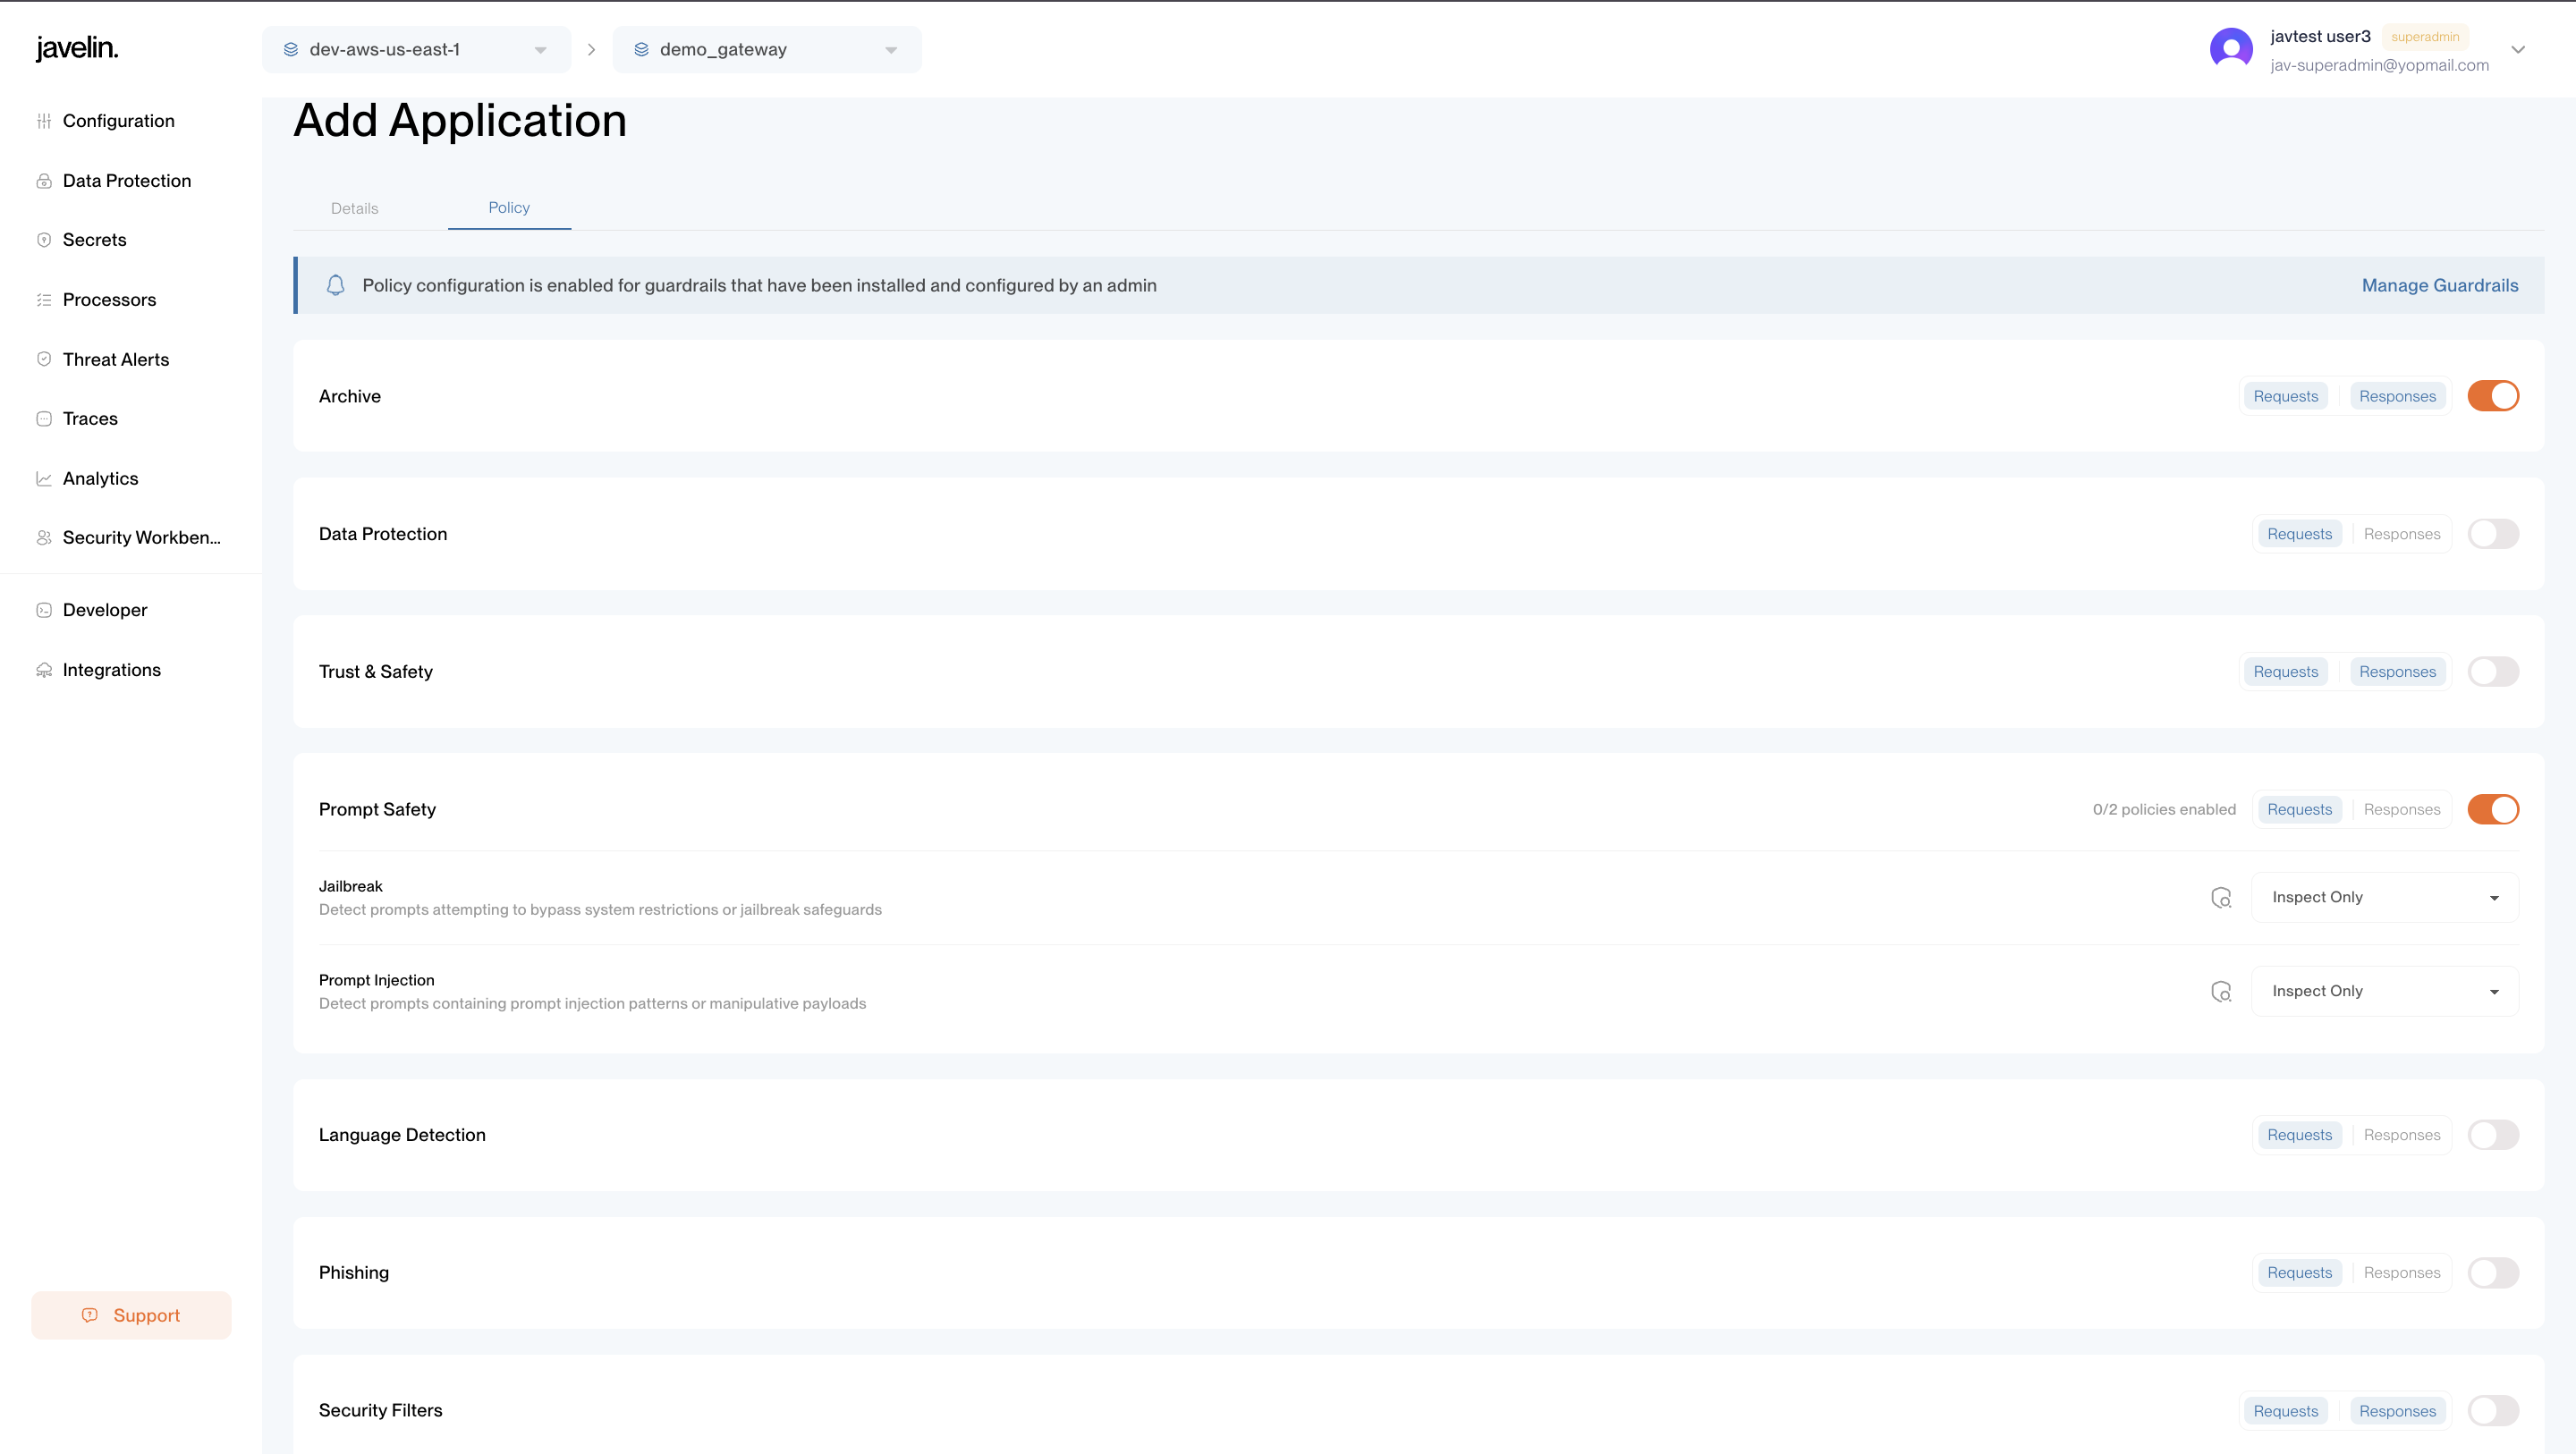
Policy Tab
- Displays all Application-level policies currently applied to this application.
- Policies help safeguard your LLM usage by applying filters such as content filtering, prompt injection detection, language detection, and other guardrail mechanisms.
- For a complete breakdown of available policies and configuration options, see the Policy Configuration Guide.
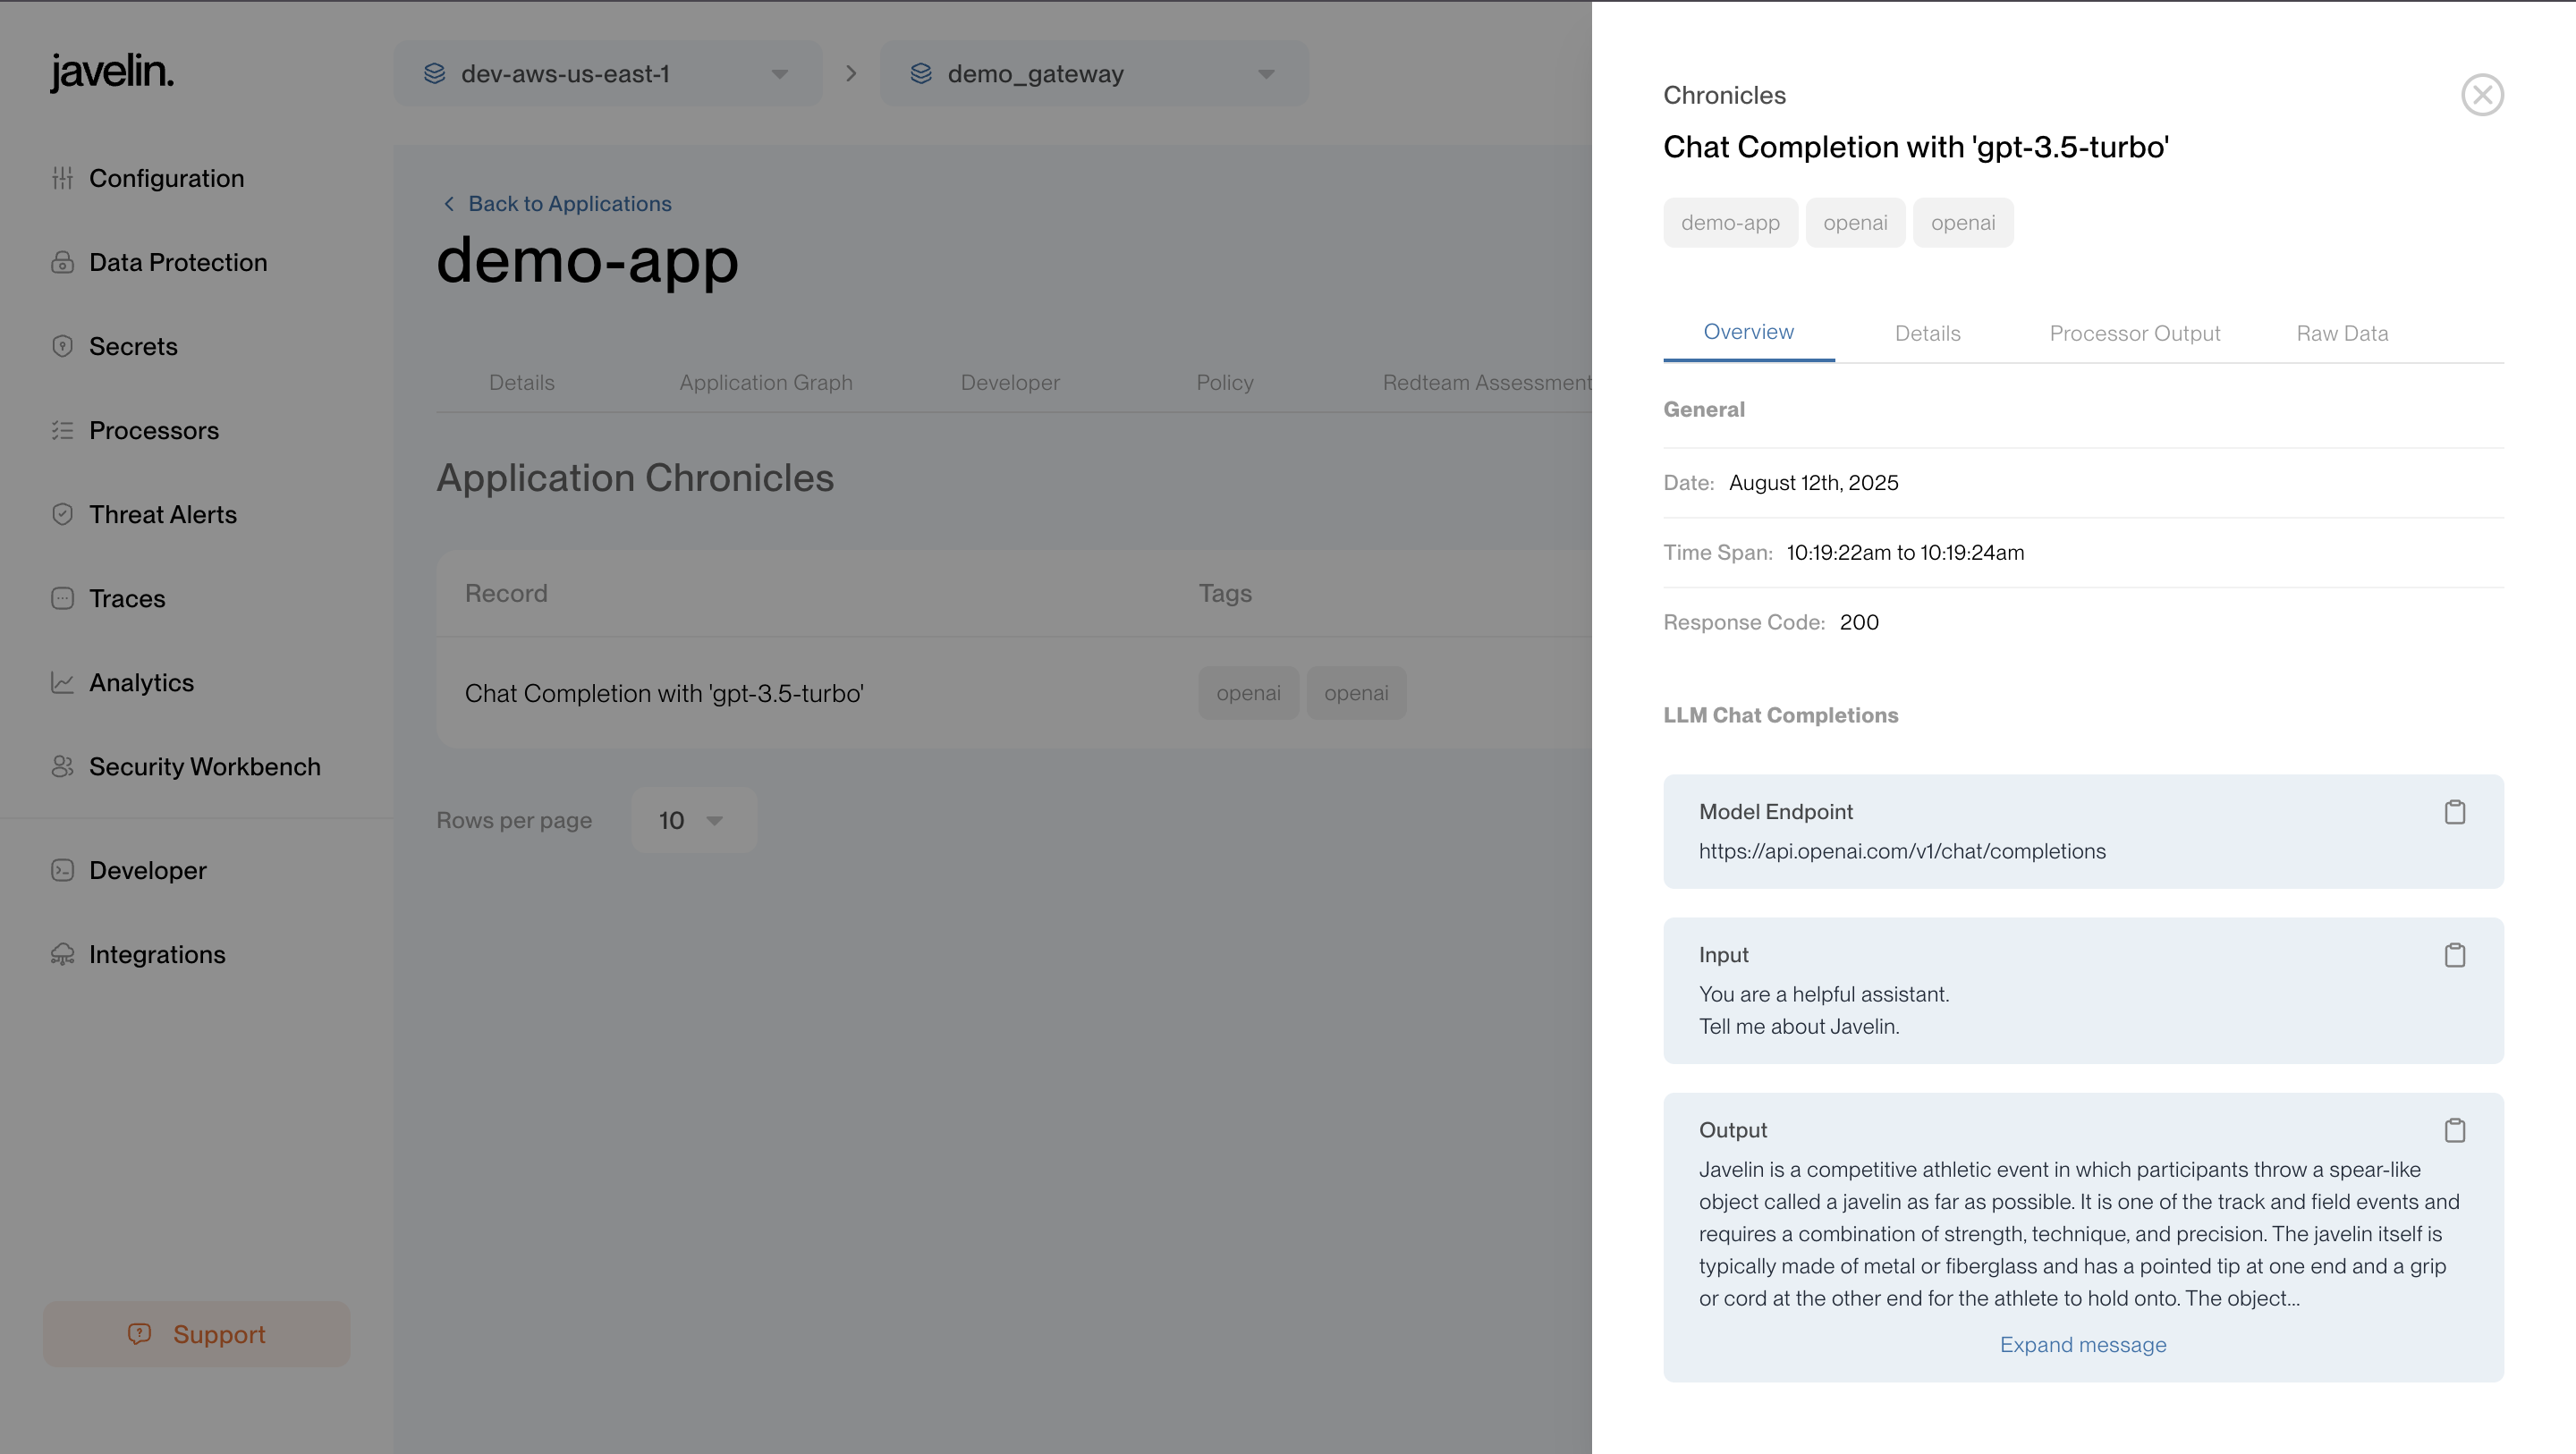
Chronicles Tab
- Displays all historical requests and responses for the application.
- Shows:
- Model request details
- Input and output from the LLM
- Guardrails data
- Raw JSON payloads
- Useful for debugging, auditing, and compliance checks.
Keep your Application API key safe. Do not expose it to repositories or include it in browser-delivered code. Use secure platforms to share it with the others.